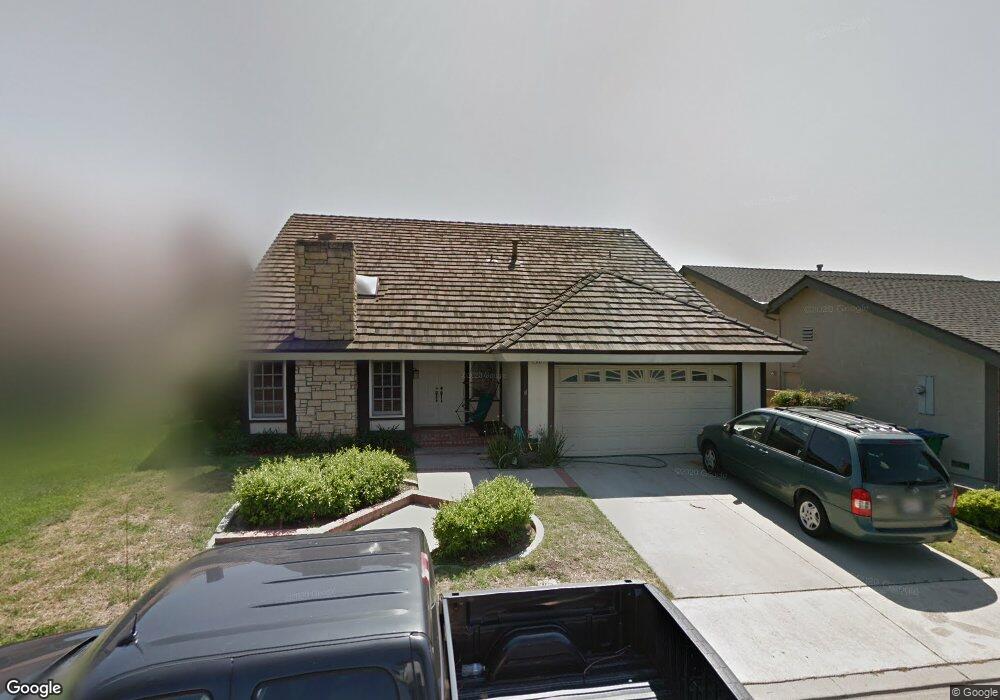
20 Brandywine Irvine, CA 92620
Northwood NeighborhoodEstimated Value: $1,735,000 - $1,958,000
4
Beds
3
Baths
2,203
Sq Ft
$828/Sq Ft
Est. Value
About This Home
This home is located at 20 Brandywine, Irvine, CA 92620 and is currently estimated at $1,822,989, approximately $827 per square foot. 20 Brandywine is a home located in Orange County with nearby schools including Brywood Elementary School, Sierra Vista Middle School, and Northwood High School.
Ownership History
Date
Name
Owned For
Owner Type
Purchase Details
Closed on
Feb 10, 2004
Sold by
Harding James M and White Nancy Harding
Bought by
Walton Odis and Walton Tracy
Current Estimated Value
Home Financials for this Owner
Home Financials are based on the most recent Mortgage that was taken out on this home.
Original Mortgage
$333,700
Interest Rate
5.57%
Mortgage Type
Purchase Money Mortgage
Purchase Details
Closed on
Jun 7, 2001
Sold by
Butler Emogene C
Bought by
Butler Emogene C and The Emogene C Butler Revocable Trust
Home Financials for this Owner
Home Financials are based on the most recent Mortgage that was taken out on this home.
Original Mortgage
$204,000
Interest Rate
7.15%
Create a Home Valuation Report for This Property
The Home Valuation Report is an in-depth analysis detailing your home's value as well as a comparison with similar homes in the area
Home Values in the Area
Average Home Value in this Area
Purchase History
| Date | Buyer | Sale Price | Title Company |
|---|---|---|---|
| Walton Odis | $560,000 | Landwood Title Company | |
| Butler Emogene C | -- | Benefit Land Title Company | |
| Butler Emogene C | -- | Benefit Land Title Company |
Source: Public Records
Mortgage History
| Date | Status | Borrower | Loan Amount |
|---|---|---|---|
| Previous Owner | Walton Odis | $333,700 | |
| Previous Owner | Butler Emogene C | $204,000 | |
| Closed | Walton Odis | $26,300 |
Source: Public Records
Tax History
| Year | Tax Paid | Tax Assessment Tax Assessment Total Assessment is a certain percentage of the fair market value that is determined by local assessors to be the total taxable value of land and additions on the property. | Land | Improvement |
|---|---|---|---|---|
| 2025 | $8,296 | $796,195 | $582,643 | $213,552 |
| 2024 | $8,296 | $780,584 | $571,219 | $209,365 |
| 2023 | $8,082 | $765,279 | $560,019 | $205,260 |
| 2022 | $7,929 | $750,274 | $549,038 | $201,236 |
| 2021 | $7,749 | $735,563 | $538,272 | $197,291 |
| 2020 | $7,706 | $728,021 | $532,752 | $195,269 |
| 2019 | $7,535 | $713,747 | $522,306 | $191,441 |
| 2018 | $7,403 | $699,752 | $512,064 | $187,688 |
| 2017 | $7,251 | $686,032 | $502,024 | $184,008 |
| 2016 | $6,930 | $672,581 | $492,181 | $180,400 |
| 2015 | $6,826 | $662,479 | $484,788 | $177,691 |
| 2014 | $6,695 | $649,502 | $475,291 | $174,211 |
Source: Public Records
Map
Nearby Homes
Your Personal Tour Guide
Ask me questions while you tour the home.