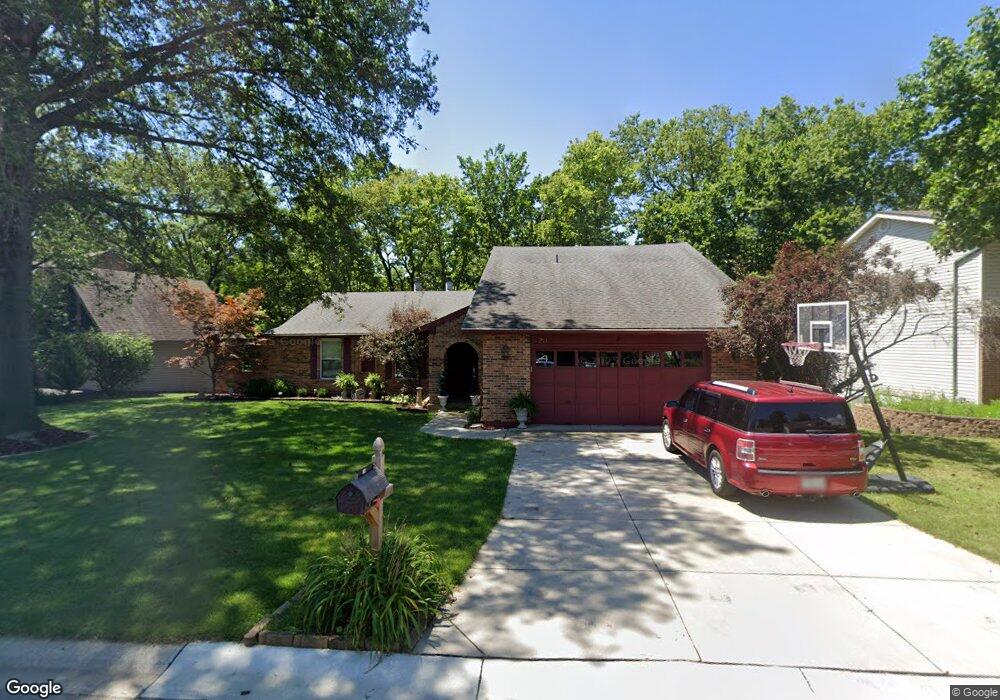
20 Confederate Way Saint Charles, MO 63303
Heritage NeighborhoodEstimated Value: $453,000 - $496,000
4
Beds
4
Baths
2,483
Sq Ft
$190/Sq Ft
Est. Value
About This Home
This home is located at 20 Confederate Way, Saint Charles, MO 63303 and is currently estimated at $471,336, approximately $189 per square foot. 20 Confederate Way is a home located in St. Charles County with nearby schools including Becky-David Elementary School, Barnwell Middle School, and Francis Howell North High School.
Ownership History
Date
Name
Owned For
Owner Type
Purchase Details
Closed on
Jun 10, 2005
Sold by
Lasater Kerry M and Lasater Lisa
Bought by
Simmons Thomas E and Simmons Barbara A
Current Estimated Value
Home Financials for this Owner
Home Financials are based on the most recent Mortgage that was taken out on this home.
Original Mortgage
$187,500
Outstanding Balance
$97,886
Interest Rate
5.76%
Mortgage Type
Fannie Mae Freddie Mac
Estimated Equity
$373,450
Purchase Details
Closed on
Apr 28, 2001
Sold by
Lasater Kerry M
Bought by
Lasater Kerry M
Purchase Details
Closed on
Oct 29, 1998
Sold by
Koerner Virginia Dena
Bought by
Lasater Kerry M and Lasater Tracy W
Home Financials for this Owner
Home Financials are based on the most recent Mortgage that was taken out on this home.
Original Mortgage
$155,300
Interest Rate
6.55%
Purchase Details
Closed on
May 3, 1997
Sold by
Helms James W and Helms Virginia
Bought by
Helms James W and Helms Virginia
Create a Home Valuation Report for This Property
The Home Valuation Report is an in-depth analysis detailing your home's value as well as a comparison with similar homes in the area
Home Values in the Area
Average Home Value in this Area
Purchase History
| Date | Buyer | Sale Price | Title Company |
|---|---|---|---|
| Simmons Thomas E | $252,500 | Ust | |
| Lasater Kerry M | -- | -- | |
| Lasater Kerry M | -- | -- | |
| Lasater Kerry M | -- | -- | |
| Helms James W | -- | -- |
Source: Public Records
Mortgage History
| Date | Status | Borrower | Loan Amount |
|---|---|---|---|
| Open | Simmons Thomas E | $187,500 | |
| Previous Owner | Lasater Kerry M | $155,300 |
Source: Public Records
Tax History
| Year | Tax Paid | Tax Assessment Tax Assessment Total Assessment is a certain percentage of the fair market value that is determined by local assessors to be the total taxable value of land and additions on the property. | Land | Improvement |
|---|---|---|---|---|
| 2025 | $4,412 | $78,904 | -- | -- |
| 2023 | $4,406 | $71,375 | $0 | $0 |
| 2022 | $3,915 | $58,719 | $0 | $0 |
| 2021 | $3,907 | $58,719 | $0 | $0 |
| 2020 | $4,083 | $59,834 | $0 | $0 |
| 2019 | $4,067 | $59,834 | $0 | $0 |
| 2018 | $3,930 | $55,187 | $0 | $0 |
| 2017 | $3,909 | $55,187 | $0 | $0 |
| 2016 | $3,536 | $50,043 | $0 | $0 |
| 2015 | $3,501 | $50,043 | $0 | $0 |
| 2014 | $3,245 | $44,967 | $0 | $0 |
Source: Public Records
Map
Nearby Homes
- 411 Savannah Ridge Dr
- 390 Portsmouth Dr
- 1625 Mount Vernon Dr Unit 4
- 1355 Hampton Rd Unit B
- 28 Serapis Ct
- 2609 Plantation Point Unit D
- 2605 Plantation Point Unit B
- 409 Fort Saratoga
- 2617 Hampton Rd Unit C
- 1380 Heritage Landing Unit 307
- 1380 Heritage Landing Unit 206
- 1465 Heritage Landing Unit 35
- 1465 Heritage Landing Unit 403
- 1465 Heritage Landing Unit 306
- 1465 Heritage Landing Unit 102
- 1465 Heritage Landing Unit 46 (410)
- 1400 Heritage Landing Unit 203
- 1400 Heritage Landing Unit 110
- 340 Woodbridge Dr
- 1436 Heritage Landing Unit 108
- 21 Confederate Way
- 19 Confederate Way
- 18 Confederate Way
- 22 Confederate Way
- 22 Burnside Ct
- 20 Burnside Ct
- 26 Confederate Way
- 25 Confederate Way
- 27 Confederate Way
- 24 Burnside Ct
- 23 Confederate Way
- 17 Confederate Way
- 24 Confederate Way
- 16 Burnside Ct
- 26 Burnside Ct
- 43 Bunker Hill
- 44 Bunker Hill
- 45 Bunker Hill
- 29 Confederate Way
- 16 Confederate Way
Your Personal Tour Guide
Ask me questions while you tour the home.