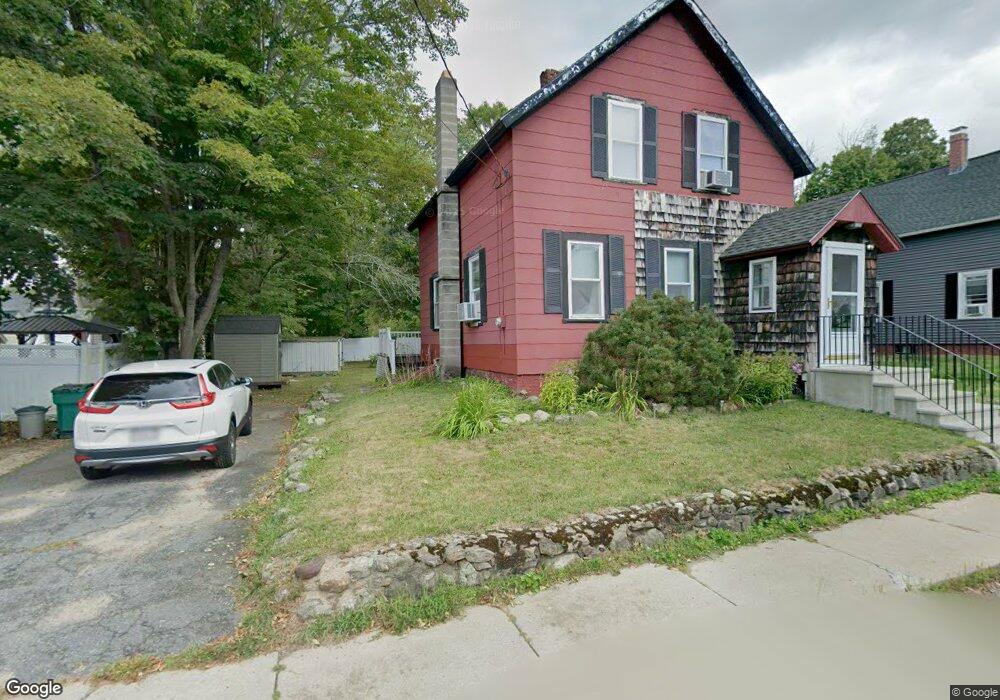
20 Cross St Ashburnham, MA 01430
Estimated Value: $289,000 - $342,000
3
Beds
2
Baths
1,118
Sq Ft
$276/Sq Ft
Est. Value
About This Home
This home is located at 20 Cross St, Ashburnham, MA 01430 and is currently estimated at $308,916, approximately $276 per square foot. 20 Cross St is a home located in Worcester County with nearby schools including Oakmont Regional High School, Wachusett Hills Christian School, and Cushing Academy.
Ownership History
Date
Name
Owned For
Owner Type
Purchase Details
Closed on
Jul 28, 2005
Sold by
Mazaika Paul J
Bought by
Janssens 2Nd Leo and Janssens Maribeth
Current Estimated Value
Home Financials for this Owner
Home Financials are based on the most recent Mortgage that was taken out on this home.
Original Mortgage
$176,000
Outstanding Balance
$92,515
Interest Rate
5.67%
Mortgage Type
Purchase Money Mortgage
Estimated Equity
$216,402
Purchase Details
Closed on
Jan 28, 1999
Sold by
Mass Hsg Finance Agenc
Bought by
Mazaika Paul J
Home Financials for this Owner
Home Financials are based on the most recent Mortgage that was taken out on this home.
Original Mortgage
$54,000
Interest Rate
6.67%
Mortgage Type
Purchase Money Mortgage
Purchase Details
Closed on
Oct 29, 1998
Sold by
Roy Robert G
Bought by
Mass Hsg Finance Agenc
Create a Home Valuation Report for This Property
The Home Valuation Report is an in-depth analysis detailing your home's value as well as a comparison with similar homes in the area
Home Values in the Area
Average Home Value in this Area
Purchase History
| Date | Buyer | Sale Price | Title Company |
|---|---|---|---|
| Janssens 2Nd Leo | $220,000 | -- | |
| Janssens 2Nd Leo | $220,000 | -- | |
| Mazaika Paul J | $60,000 | -- | |
| Mazaika Paul J | $60,000 | -- | |
| Mass Hsg Finance Agenc | $62,000 | -- | |
| Mass Hsg Finance Agenc | $62,000 | -- |
Source: Public Records
Mortgage History
| Date | Status | Borrower | Loan Amount |
|---|---|---|---|
| Open | Janssens 2Nd Leo | $176,000 | |
| Closed | Janssens 2Nd Leo | $44,000 | |
| Closed | Mass Hsg Finance Agenc | $176,000 | |
| Previous Owner | Mass Hsg Finance Agenc | $54,000 |
Source: Public Records
Tax History
| Year | Tax Paid | Tax Assessment Tax Assessment Total Assessment is a certain percentage of the fair market value that is determined by local assessors to be the total taxable value of land and additions on the property. | Land | Improvement |
|---|---|---|---|---|
| 2025 | $3,520 | $236,700 | $32,900 | $203,800 |
| 2024 | $3,465 | $220,000 | $32,900 | $187,100 |
| 2023 | $3,543 | $214,100 | $32,900 | $181,200 |
| 2022 | $3,599 | $190,600 | $32,700 | $157,900 |
| 2021 | $3,138 | $174,700 | $32,700 | $142,000 |
| 2020 | $3,511 | $174,700 | $32,700 | $142,000 |
| 2019 | $3,286 | $145,700 | $32,700 | $113,000 |
| 2018 | $2,757 | $137,900 | $31,100 | $106,800 |
| 2017 | $3,257 | $141,800 | $35,700 | $106,100 |
| 2016 | $3,144 | $138,200 | $35,100 | $103,100 |
| 2015 | $3,079 | $138,200 | $35,100 | $103,100 |
Source: Public Records
Map
Nearby Homes
- 5 Russell Ave
- Lot 6 Suffolk Ln
- Lot 5 Suffolk Ln
- 38 Hemlock Rd
- 36 Hillandale Rd
- 15 Kirali Ct
- 18 Corey Hill Rd
- 75 Willard Rd
- 77 Barrel Rd
- 9 Willard Rd
- 326 Matthews St
- 100 Main St
- 149 Bragg Hill Rd
- 14 Central St
- Lot 40C Winchendon Rd
- 280 Stone St
- 2 Stone St
- 105 Ridgewood Ln Unit 7
- 105 Ridgewood Ln Unit 22
- 53 Ridgewood Ln Unit 16
Your Personal Tour Guide
Ask me questions while you tour the home.