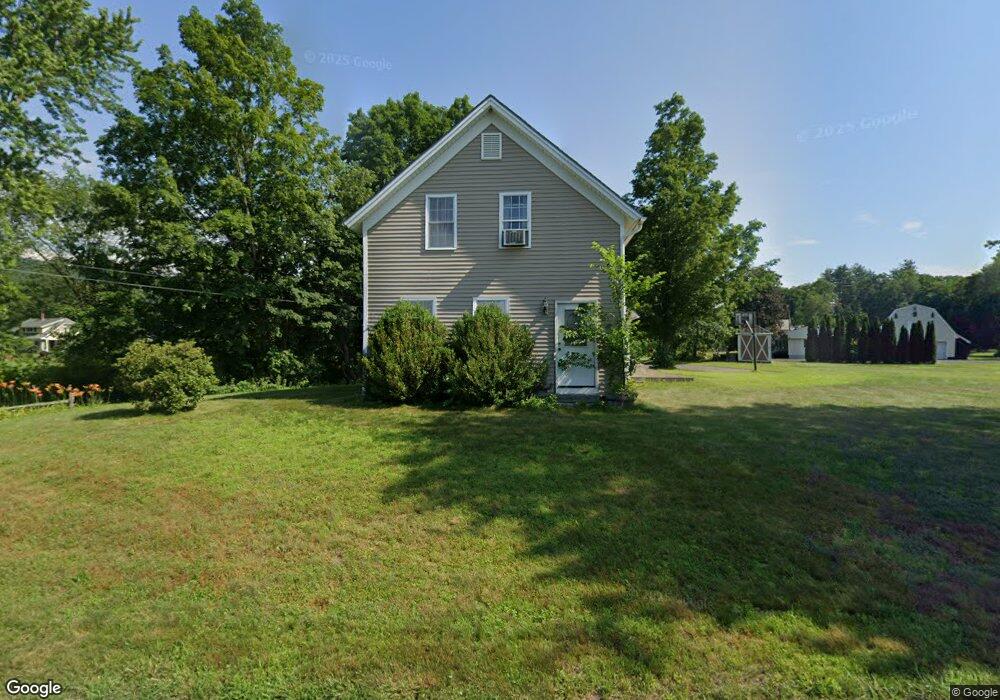
20 Cross St Bernardston, MA 01337
Estimated Value: $351,146 - $396,000
3
Beds
1
Bath
1,328
Sq Ft
$280/Sq Ft
Est. Value
About This Home
This home is located at 20 Cross St, Bernardston, MA 01337 and is currently estimated at $372,287, approximately $280 per square foot. 20 Cross St is a home located in Franklin County with nearby schools including Pioneer Valley Regional, Greenfield Center School, and Full Circle School.
Ownership History
Date
Name
Owned For
Owner Type
Purchase Details
Closed on
Aug 2, 2018
Sold by
Curtis Bradley C and Curtis Stacey A
Bought by
Curtis Bradley C
Current Estimated Value
Purchase Details
Closed on
May 23, 2008
Sold by
Baird Jeffrey S and Tognarelli Joel C
Bought by
Curtis Bradley C and Curtis Stacey A
Purchase Details
Closed on
Mar 19, 2007
Sold by
Curtis Sylvia M
Bought by
Baird Jeffrey S and Tognarelli Joel C
Purchase Details
Closed on
May 2, 2006
Sold by
Curtis Fred C
Bought by
Curtis Sylvia M
Purchase Details
Closed on
Jul 3, 2003
Sold by
Curtis Sylvia M
Bought by
Curtis Fred C
Create a Home Valuation Report for This Property
The Home Valuation Report is an in-depth analysis detailing your home's value as well as a comparison with similar homes in the area
Home Values in the Area
Average Home Value in this Area
Purchase History
| Date | Buyer | Sale Price | Title Company |
|---|---|---|---|
| Curtis Bradley C | -- | -- | |
| Curtis Bradley C | -- | -- | |
| Curtis Bradley C | $215,000 | -- | |
| Curtis Bradley C | $215,000 | -- | |
| Baird Jeffrey S | $108,000 | -- | |
| Baird Jeffrey S | $108,000 | -- | |
| Curtis Sylvia M | -- | -- | |
| Curtis Sylvia M | -- | -- | |
| Curtis Fred C | -- | -- | |
| Curtis Fred C | -- | -- |
Source: Public Records
Mortgage History
| Date | Status | Borrower | Loan Amount |
|---|---|---|---|
| Previous Owner | Curtis Fred C | $195,756 | |
| Previous Owner | Curtis Fred C | $215,352 |
Source: Public Records
Tax History
| Year | Tax Paid | Tax Assessment Tax Assessment Total Assessment is a certain percentage of the fair market value that is determined by local assessors to be the total taxable value of land and additions on the property. | Land | Improvement |
|---|---|---|---|---|
| 2025 | $4,582 | $321,100 | $53,000 | $268,100 |
| 2024 | $4,858 | $297,300 | $53,000 | $244,300 |
| 2023 | $4,931 | $308,400 | $51,200 | $257,200 |
| 2022 | $4,742 | $275,700 | $46,600 | $229,100 |
| 2021 | $4,329 | $233,100 | $39,400 | $193,700 |
| 2020 | $4,404 | $236,900 | $39,500 | $197,400 |
| 2019 | $4,311 | $219,500 | $39,500 | $180,000 |
| 2018 | $4,205 | $205,400 | $40,000 | $165,400 |
| 2017 | $4,063 | $205,400 | $40,000 | $165,400 |
| 2016 | $3,997 | $205,400 | $40,000 | $165,400 |
| 2015 | $3,880 | $208,800 | $47,100 | $161,700 |
Source: Public Records
Map
Nearby Homes
- 75 South St Unit 3
- 47 Cross St
- 23 Industrial Dr
- 0 Fox Hill Rd Unit 73477185
- 1 Northfield Rd
- 6 Burrows Turnpike Rd
- 20 Merrifield Rd
- 90 Bald Mountain Rd
- 539 Fox Hill Rd
- Lot 9 Fox Hill Rd (Off)
- 34 Brookside Ave
- 001 Adams Rd
- 56 Brattleboro Rd
- 40 Shedd Rd
- 182 Main Rd
- 696 Bernardston Rd
- 52 Canada Hill Rd
- 20 Walnut St
- 132 Poplar St
- 77 Summer St
Your Personal Tour Guide
Ask me questions while you tour the home.