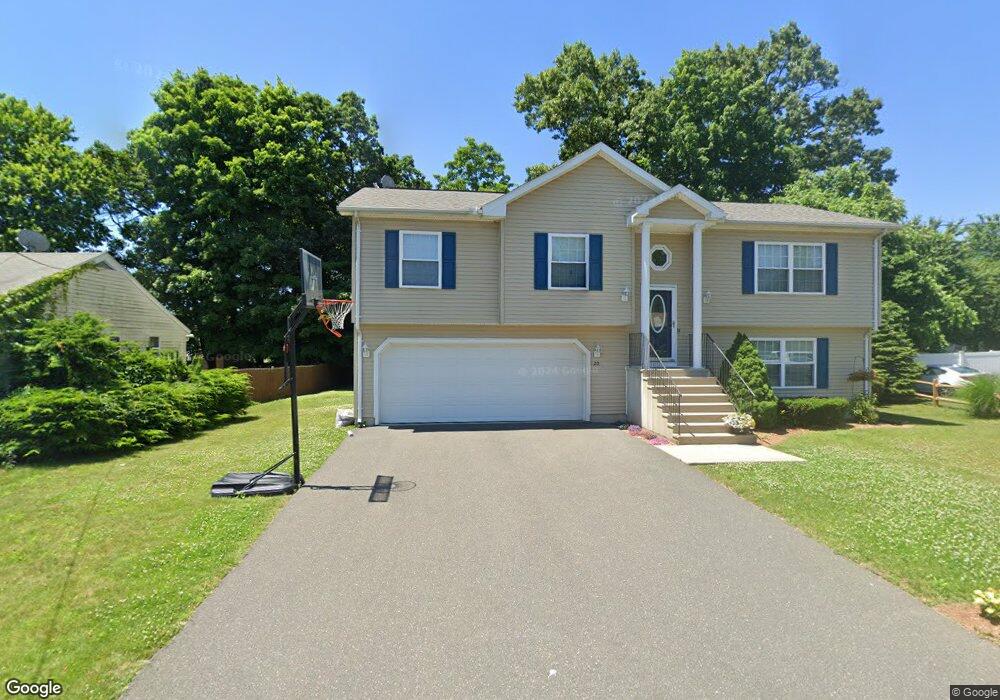
20 David St Chicopee, MA 01020
Chicopee Falls NeighborhoodEstimated Value: $339,000 - $594,000
3
Beds
2
Baths
1,250
Sq Ft
$357/Sq Ft
Est. Value
About This Home
This home is located at 20 David St, Chicopee, MA 01020 and is currently estimated at $446,716, approximately $357 per square foot. 20 David St is a home located in Hampden County with nearby schools including Litwin Elementary School, Bellamy Middle School, and Chicopee High School.
Ownership History
Date
Name
Owned For
Owner Type
Purchase Details
Closed on
Oct 23, 2009
Sold by
Ahh Inc
Bought by
Trowbridge Ryan E and Trowbridge Moskal-Trowbridge J
Current Estimated Value
Home Financials for this Owner
Home Financials are based on the most recent Mortgage that was taken out on this home.
Original Mortgage
$204,000
Outstanding Balance
$132,192
Interest Rate
5.09%
Mortgage Type
Purchase Money Mortgage
Estimated Equity
$314,524
Create a Home Valuation Report for This Property
The Home Valuation Report is an in-depth analysis detailing your home's value as well as a comparison with similar homes in the area
Home Values in the Area
Average Home Value in this Area
Purchase History
| Date | Buyer | Sale Price | Title Company |
|---|---|---|---|
| Trowbridge Ryan E | $242,000 | -- |
Source: Public Records
Mortgage History
| Date | Status | Borrower | Loan Amount |
|---|---|---|---|
| Open | Trowbridge Ryan E | $204,000 |
Source: Public Records
Tax History
| Year | Tax Paid | Tax Assessment Tax Assessment Total Assessment is a certain percentage of the fair market value that is determined by local assessors to be the total taxable value of land and additions on the property. | Land | Improvement |
|---|---|---|---|---|
| 2025 | $5,879 | $387,800 | $110,800 | $277,000 |
| 2024 | $5,582 | $378,200 | $108,600 | $269,600 |
| 2023 | $5,340 | $352,500 | $98,700 | $253,800 |
| 2022 | $4,908 | $288,900 | $85,800 | $203,100 |
| 2021 | $4,762 | $270,400 | $78,000 | $192,400 |
| 2020 | $4,580 | $262,300 | $81,500 | $180,800 |
| 2019 | $4,499 | $250,500 | $81,500 | $169,000 |
| 2018 | $4,374 | $238,900 | $77,600 | $161,300 |
| 2017 | $3,746 | $216,400 | $70,000 | $146,400 |
| 2016 | $3,685 | $217,900 | $70,000 | $147,900 |
| 2015 | $3,822 | $217,900 | $70,000 | $147,900 |
| 2014 | $1,911 | $217,900 | $70,000 | $147,900 |
Source: Public Records
Map
Nearby Homes
- 41 Oakhill Cir Unit 41
- 461 Sheridan St
- 585 Sheridan St Unit 46
- 57 Colonial Cir Unit D
- 23 Jackson St
- 238 E Main St
- 111 Festival Cir
- 26 Belcher St
- 72 Holiday Cir
- 30 Butler Ave
- 156 East St
- 103 Lauzier Terrace
- 1697 Westover Rd
- 40 Lauzier Terrace
- 60 Hawthorn St
- 1760 Westover Rd Unit 2
- 1150 Granby Rd
- 109 Church St
- 1246 Granby Rd Unit 43
- 1246 Granby Rd Unit 66
Your Personal Tour Guide
Ask me questions while you tour the home.