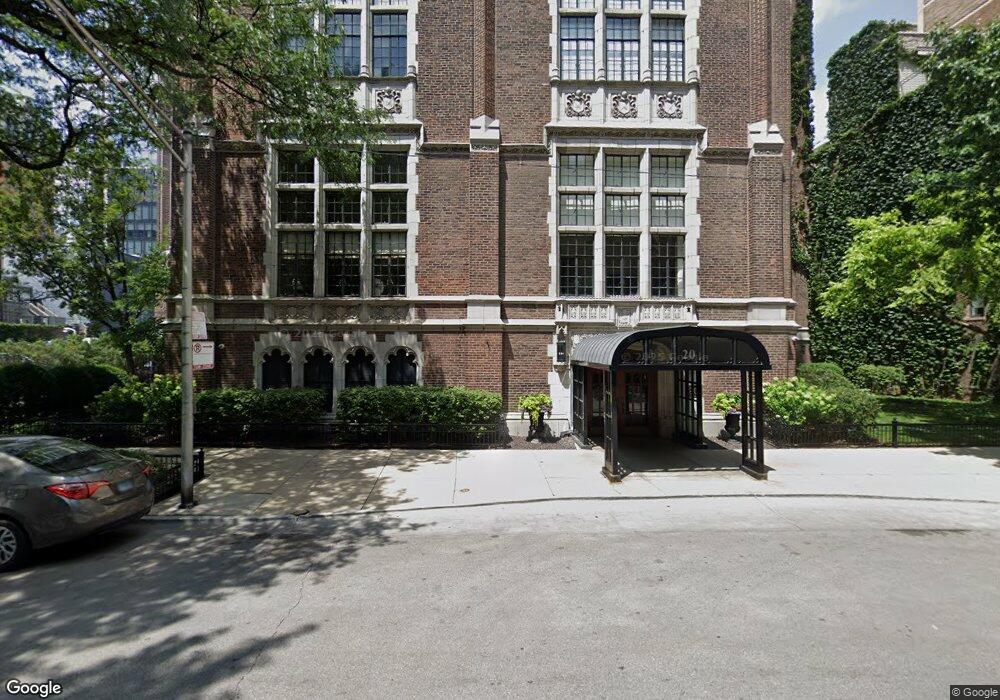
20 E Cedar St Unit 8C Chicago, IL 60611
Gold Coast NeighborhoodEstimated Value: $1,193,000 - $1,328,000
3
Beds
3
Baths
2,850
Sq Ft
$439/Sq Ft
Est. Value
About This Home
This home is located at 20 E Cedar St Unit 8C, Chicago, IL 60611 and is currently estimated at $1,250,181, approximately $438 per square foot. 20 E Cedar St Unit 8C is a home located in Cook County with nearby schools including Ogden Elementary School, Lincoln Park High School, and Frances Xavier Warde School.
Ownership History
Date
Name
Owned For
Owner Type
Purchase Details
Closed on
Jul 20, 2011
Sold by
Linn Elyse M
Bought by
Fey Lawrence C
Current Estimated Value
Home Financials for this Owner
Home Financials are based on the most recent Mortgage that was taken out on this home.
Original Mortgage
$875,000
Outstanding Balance
$584,123
Interest Rate
4.12%
Mortgage Type
Unknown
Estimated Equity
$666,058
Purchase Details
Closed on
Jan 6, 2008
Sold by
Destefano James R and Destefano Judith N
Bought by
Linn Elyse M
Purchase Details
Closed on
Aug 28, 2000
Sold by
Tucker Alice Altmann
Bought by
Destefano James R and Destefano Judith N
Purchase Details
Closed on
Mar 1, 1996
Sold by
Nbd Bank
Bought by
Tucker W Randolph
Create a Home Valuation Report for This Property
The Home Valuation Report is an in-depth analysis detailing your home's value as well as a comparison with similar homes in the area
Home Values in the Area
Average Home Value in this Area
Purchase History
| Date | Buyer | Sale Price | Title Company |
|---|---|---|---|
| Fey Lawrence C | $1,180,000 | Git | |
| Linn Elyse M | $1,780,000 | First American Title Ins Co | |
| Destefano James R | $835,000 | Chicago Title Insurance Co | |
| Tucker W Randolph | -- | -- |
Source: Public Records
Mortgage History
| Date | Status | Borrower | Loan Amount |
|---|---|---|---|
| Open | Fey Lawrence C | $875,000 |
Source: Public Records
Tax History
| Year | Tax Paid | Tax Assessment Tax Assessment Total Assessment is a certain percentage of the fair market value that is determined by local assessors to be the total taxable value of land and additions on the property. | Land | Improvement |
|---|---|---|---|---|
| 2025 | $22,720 | $112,165 | $12,422 | $99,743 |
| 2024 | $22,720 | $112,165 | $12,422 | $99,743 |
| 2023 | $22,127 | $111,000 | $10,001 | $100,999 |
| 2022 | $22,127 | $111,000 | $10,001 | $100,999 |
| 2021 | $21,651 | $110,999 | $10,001 | $100,998 |
| 2020 | $21,295 | $98,695 | $7,000 | $91,695 |
| 2019 | $20,829 | $107,101 | $7,000 | $100,101 |
| 2018 | $20,477 | $107,101 | $7,000 | $100,101 |
| 2017 | $20,952 | $100,704 | $5,600 | $95,104 |
| 2016 | $19,670 | $100,704 | $5,600 | $95,104 |
| 2015 | $17,973 | $100,704 | $5,600 | $95,104 |
| 2014 | $17,252 | $95,553 | $4,500 | $91,053 |
| 2013 | $17,379 | $95,553 | $4,500 | $91,053 |
Source: Public Records
Map
Nearby Homes
- 45 E Cedar St Unit 200
- 41 E Elm St
- 73 E Elm St Unit 12D
- 73 E Elm St Unit 7B
- 73 E Elm St Unit 4B
- 33 E Cedar St Unit 15F
- 33 E Cedar St Unit 7D
- 37 E Elm St
- 20 E Cedar St Unit 8B
- 50 E Bellevue Place Unit 1504
- 100 E Bellevue Place Unit 23B
- 30 E Elm St Unit 20G
- 1100 N Lake Shore Dr Unit 11B
- 1100 N Lake Shore Dr Unit 7B
- 53 E Division St
- 1120 N Lake Shore Dr Unit 18CD
- 1120 N Lake Shore Dr Unit 15A
- 1110 N Lake Shore Dr Unit 20S
- 1120 N Lake Shore Dr Unit 10C
- 1150 N Lake Shore Dr Unit 19A
- 20 E Cedar St Unit PH19C
- 20 E Cedar St Unit 12C
- 20 E Cedar St Unit 14D
- 20 E Cedar St Unit 14AB
- 20 E Cedar St Unit 4B
- 20 E Cedar St Unit 2A
- 20 E Cedar St Unit 12D
- 20 E Cedar St Unit 12B
- 20 E Cedar St Unit 4F
- 20 E Cedar St Unit 4E
- 20 E Cedar St Unit 18D
- 20 E Cedar St Unit 16D
- 20 E Cedar St Unit 6D
- 20 E Cedar St Unit 19C
- 20 E Cedar St Unit 19D
- 20 E Cedar St Unit 6A
- 20 E Cedar St Unit 15C
- 20 E Cedar St Unit 10D
- 20 E Cedar St Unit 4A
- 20 E Cedar St Unit 4C
Your Personal Tour Guide
Ask me questions while you tour the home.