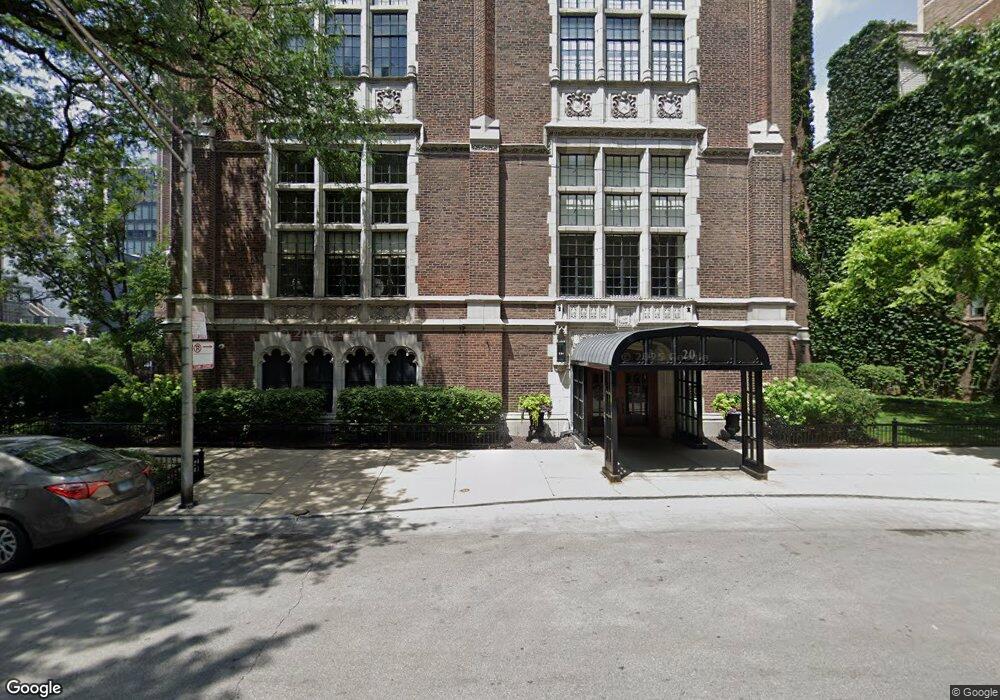
20 E Cedar St Unit PH19C Chicago, IL 60611
Gold Coast NeighborhoodEstimated Value: $1,183,000 - $1,537,000
Studio
4
Baths
--
Sq Ft
19,079
Sq Ft Lot
About This Home
This home is located at 20 E Cedar St Unit PH19C, Chicago, IL 60611 and is currently estimated at $1,360,000. 20 E Cedar St Unit PH19C is a home located in Cook County with nearby schools including Ogden Elementary School, Lincoln Park High School, and Frances Xavier Warde School.
Ownership History
Date
Name
Owned For
Owner Type
Purchase Details
Closed on
Mar 15, 2015
Sold by
Declaration Daluga Jr William G
Bought by
Brandt Carol and Carol Brandt Revocable Trust
Current Estimated Value
Purchase Details
Closed on
Mar 13, 2015
Sold by
Wall Christopher
Bought by
Declaration Wall Christopher N and Christopher N Wall Declaration Of Trust
Purchase Details
Closed on
Aug 28, 2014
Sold by
Sassi Brian A
Bought by
Wall Christopher
Purchase Details
Closed on
Feb 26, 2014
Sold by
Glazer Bryan
Bought by
Sassi Brian A and Brian A Sassi Living Trust
Home Financials for this Owner
Home Financials are based on the most recent Mortgage that was taken out on this home.
Original Mortgage
$500,000
Interest Rate
2.74%
Mortgage Type
Adjustable Rate Mortgage/ARM
Create a Home Valuation Report for This Property
The Home Valuation Report is an in-depth analysis detailing your home's value as well as a comparison with similar homes in the area
Home Values in the Area
Average Home Value in this Area
Purchase History
| Date | Buyer | Sale Price | Title Company |
|---|---|---|---|
| Brandt Carol | $1,900,000 | First American Title | |
| Declaration Wall Christopher N | -- | None Available | |
| Wall Christopher | $1,125,000 | First American Title | |
| Sassi Brian A | $995,000 | Attorneys Title Guaranty Fun |
Source: Public Records
Mortgage History
| Date | Status | Borrower | Loan Amount |
|---|---|---|---|
| Previous Owner | Sassi Brian A | $500,000 |
Source: Public Records
Tax History
| Year | Tax Paid | Tax Assessment Tax Assessment Total Assessment is a certain percentage of the fair market value that is determined by local assessors to be the total taxable value of land and additions on the property. | Land | Improvement |
|---|---|---|---|---|
| 2025 | $22,583 | $114,367 | $12,666 | $101,701 |
| 2024 | $22,583 | $114,367 | $12,666 | $101,701 |
| 2023 | $21,976 | $113,000 | $10,198 | $102,802 |
| 2022 | $21,976 | $113,000 | $10,198 | $102,802 |
| 2021 | $21,518 | $112,999 | $10,197 | $102,802 |
| 2020 | $21,727 | $100,634 | $7,138 | $93,496 |
| 2019 | $21,251 | $109,204 | $7,138 | $102,066 |
| 2018 | $20,893 | $109,204 | $7,138 | $102,066 |
| 2017 | $21,378 | $102,682 | $5,710 | $96,972 |
| 2016 | $20,566 | $102,682 | $5,710 | $96,972 |
| 2015 | $18,816 | $102,682 | $5,710 | $96,972 |
| 2014 | $17,600 | $97,429 | $4,588 | $92,841 |
| 2013 | $17,242 | $97,429 | $4,588 | $92,841 |
Source: Public Records
Map
Nearby Homes
- 40 E Cedar St Unit 8CD
- 40 E Cedar St Unit 18B
- 41 E Elm St
- 37 E Elm St
- 20 E Cedar St Unit 8B
- 33 E Cedar St Unit 15F
- 33 E Cedar St Unit 7D
- 45 E Cedar St Unit 200
- 73 E Elm St Unit 12D
- 73 E Elm St Unit 7B
- 50 E Bellevue Place Unit 1504
- 30 E Elm St Unit 20G
- 53 E Division St
- 4 E Elm St Unit 12S
- 1100 N Lake Shore Dr Unit 11B
- 1120 N Lake Shore Dr Unit 18CD
- 1120 N Lake Shore Dr Unit 15A
- 1110 N Lake Shore Dr Unit 20S
- 1110 N Lake Shore Dr Unit 29S
- 1120 N Lake Shore Dr Unit 10C
- 20 E Cedar St Unit 12C
- 20 E Cedar St Unit 14D
- 20 E Cedar St Unit 14AB
- 20 E Cedar St Unit 4B
- 20 E Cedar St Unit 2A
- 20 E Cedar St Unit 12D
- 20 E Cedar St Unit 12B
- 20 E Cedar St Unit 4F
- 20 E Cedar St Unit 4E
- 20 E Cedar St Unit 18D
- 20 E Cedar St Unit 16D
- 20 E Cedar St Unit 6D
- 20 E Cedar St Unit 19C
- 20 E Cedar St Unit 19D
- 20 E Cedar St Unit 8C
- 20 E Cedar St Unit 6A
- 20 E Cedar St Unit 15C
- 20 E Cedar St Unit 10D
- 20 E Cedar St Unit 4A
- 20 E Cedar St Unit 4C
Your Personal Tour Guide
Ask me questions while you tour the home.