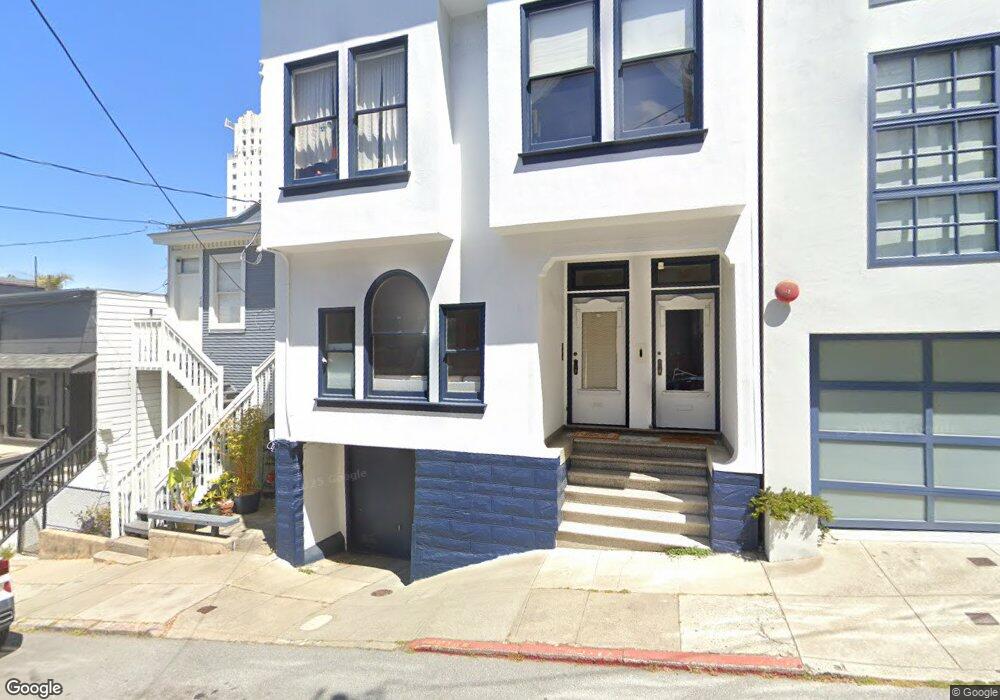
20 Glover St Unit 22 San Francisco, CA 94109
Russian Hill NeighborhoodEstimated Value: $1,597,000 - $1,789,000
--
Bed
2
Baths
2,138
Sq Ft
$792/Sq Ft
Est. Value
About This Home
This home is located at 20 Glover St Unit 22, San Francisco, CA 94109 and is currently estimated at $1,692,360, approximately $791 per square foot. 20 Glover St Unit 22 is a home located in San Francisco County with nearby schools including Yick Wo Elementary School, Francisco Middle School, and Cathedral School for Boys.
Ownership History
Date
Name
Owned For
Owner Type
Purchase Details
Closed on
Jun 20, 2025
Sold by
Basuino Residuary Trust and Basuino Herbert A
Bought by
Basuino Marital Trust and Basuino
Current Estimated Value
Purchase Details
Closed on
Nov 13, 2021
Sold by
Basuino Robert J
Bought by
Basuino Family Trust
Purchase Details
Closed on
Sep 22, 2017
Sold by
Basuino Robert J
Bought by
Basuino Robert J and Jenkms Diane M
Purchase Details
Closed on
Sep 18, 2002
Sold by
Meier Murphy Anita L
Bought by
Meier Murphy Anita L
Purchase Details
Closed on
Apr 7, 2002
Sold by
Murphy Thomas F and Meier Murphy Anita L
Bought by
Meier Murphy Anita L
Purchase Details
Closed on
Jun 28, 2001
Sold by
Basuino Joseph
Bought by
Basuino Joseph E and Basuino Ann M
Purchase Details
Closed on
Mar 10, 2000
Sold by
Basuino Herbert A
Bought by
Basuino Herbert A
Purchase Details
Closed on
Feb 10, 2000
Sold by
Basuino Herbert A and Basuino Marlene K
Bought by
Basuino Herbert A and Basuino Marlene K
Create a Home Valuation Report for This Property
The Home Valuation Report is an in-depth analysis detailing your home's value as well as a comparison with similar homes in the area
Home Values in the Area
Average Home Value in this Area
Purchase History
| Date | Buyer | Sale Price | Title Company |
|---|---|---|---|
| Basuino Marital Trust | -- | None Listed On Document | |
| Basuino Family Trust | -- | None Listed On Document | |
| Basuino Robert J | -- | None Available | |
| Meier Murphy Anita L | -- | -- | |
| Meier Murphy Anita L | -- | -- | |
| Murphy Thomas F | -- | -- | |
| Meier Murphy Anita L | -- | -- | |
| Basuino Joseph E | -- | -- | |
| Basuino Herbert A | -- | -- | |
| Basuino Herbert A | -- | -- | |
| Basuino Herbert A | -- | -- |
Source: Public Records
Tax History Compared to Growth
Tax History
| Year | Tax Paid | Tax Assessment Tax Assessment Total Assessment is a certain percentage of the fair market value that is determined by local assessors to be the total taxable value of land and additions on the property. | Land | Improvement |
|---|---|---|---|---|
| 2025 | $5,893 | $425,712 | $214,116 | $211,596 |
| 2024 | $5,893 | $417,374 | $209,922 | $207,452 |
| 2023 | $5,705 | $409,196 | $205,808 | $203,388 |
| 2022 | $5,569 | $401,178 | $201,774 | $199,404 |
| 2021 | $5,469 | $393,316 | $197,820 | $195,496 |
| 2020 | $5,610 | $389,292 | $195,796 | $193,496 |
| 2019 | $5,429 | $381,668 | $191,962 | $189,706 |
| 2018 | $5,244 | $374,190 | $188,202 | $185,988 |
| 2017 | $4,887 | $366,890 | $184,530 | $182,360 |
| 2016 | $4,778 | $359,700 | $180,915 | $178,785 |
| 2015 | $4,713 | $354,300 | $178,200 | $176,100 |
| 2014 | $4,593 | $347,365 | $174,710 | $172,655 |
Source: Public Records
Map
Nearby Homes
- 1725 Jones St Unit 3
- 164 Bernard St
- 999 Green St Unit 1501
- 999 Green St Unit 2001
- 1070 Green St Unit 801
- 947 Green St Unit 6
- 1101 Green St Unit 1801
- 1135 Green St
- 1250 Vallejo St Unit 7
- 1250 Vallejo St Unit 9
- 44 Lynch St
- 1145 Green St Unit 3
- 1950 Jones St
- 950-998 Vallejo St Unit 950 House
- 1750 Taylor St Unit 2202
- 1750 Taylor St Unit 1901
- 1750 Taylor St Unit 1401
- 1750 Taylor St Unit 1001
- 1750 Taylor St Unit 202
- 1925 Leavenworth St Unit 7
- 28A Glover St
- 14 Glover St
- 30 Glover St Unit 34
- 1115 Vallejo St Unit 1115
- 1117 Vallejo St
- 1121 Vallejo St Unit 1123
- 1127 Vallejo St Unit 1131
- 1733 Jones St Unit 1735
- 40 Glover St
- 1741 Jones St
- 1737 Jones St Unit 1739
- 1743 Jones St
- 1133 Vallejo St Unit 1135
- 1747 Jones St
- 1745 Jones St
- 1139 Vallejo St
- 15 Glover St Unit 1
- 1755 Jones St
- 33 Glover St Unit 37
- 1141 Vallejo St