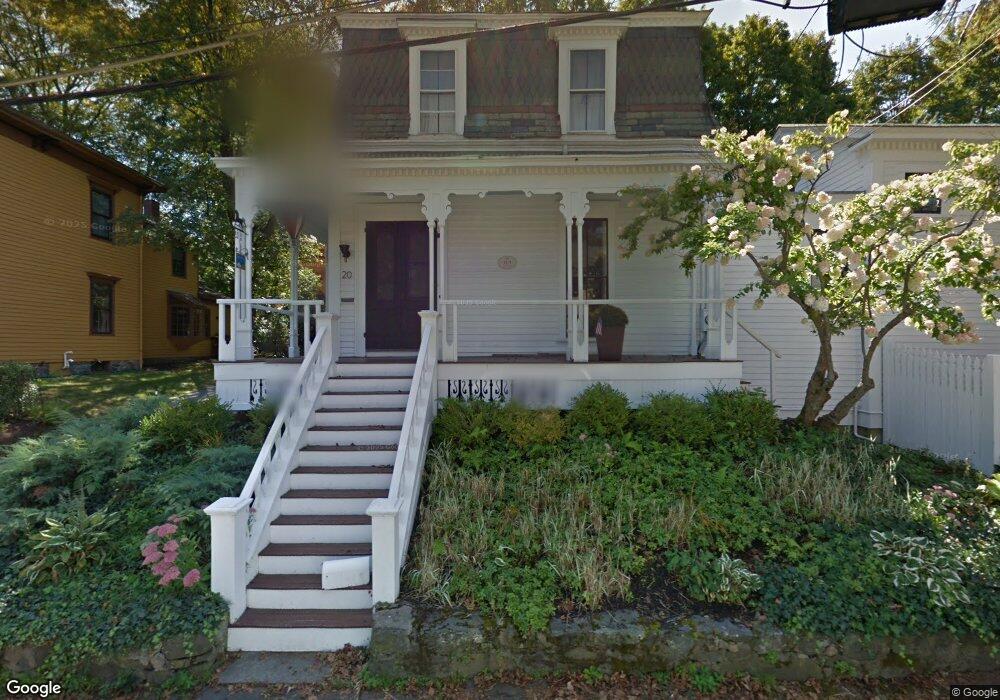
20 Hunter St West Newton, MA 02465
West Newton NeighborhoodEstimated Value: $1,036,921
4
Beds
2
Baths
3,071
Sq Ft
$338/Sq Ft
Est. Value
About This Home
This home is located at 20 Hunter St, West Newton, MA 02465 and is currently priced at $1,036,921, approximately $337 per square foot. 20 Hunter St is a home located in Middlesex County with nearby schools including Peirce Elementary School, F.A. Day Middle School, and Newton North High School.
Ownership History
Date
Name
Owned For
Owner Type
Purchase Details
Closed on
Nov 15, 2006
Sold by
Garden Jr Arthur N and Garden Elizabeth M
Bought by
Sachs Peter N and Sachs Tracy G
Current Estimated Value
Home Financials for this Owner
Home Financials are based on the most recent Mortgage that was taken out on this home.
Original Mortgage
$350,000
Outstanding Balance
$208,421
Interest Rate
6.33%
Mortgage Type
Commercial
Create a Home Valuation Report for This Property
The Home Valuation Report is an in-depth analysis detailing your home's value as well as a comparison with similar homes in the area
Home Values in the Area
Average Home Value in this Area
Purchase History
| Date | Buyer | Sale Price | Title Company |
|---|---|---|---|
| Sachs Peter N | $530,000 | -- |
Source: Public Records
Mortgage History
| Date | Status | Borrower | Loan Amount |
|---|---|---|---|
| Open | Sachs Peter N | $350,000 |
Source: Public Records
Tax History Compared to Growth
Tax History
| Year | Tax Paid | Tax Assessment Tax Assessment Total Assessment is a certain percentage of the fair market value that is determined by local assessors to be the total taxable value of land and additions on the property. | Land | Improvement |
|---|---|---|---|---|
| 2025 | -- | $1,714,300 | $1,000,900 | $713,400 |
| 2024 | -- | $1,604,000 | $971,700 | $632,300 |
| 2023 | $0 | $1,479,000 | $751,900 | $727,100 |
| 2022 | $0 | $1,369,400 | $696,200 | $673,200 |
| 2021 | $0 | $1,291,900 | $656,800 | $635,100 |
| 2020 | $0 | $1,291,900 | $656,800 | $635,100 |
| 2019 | $0 | $1,254,300 | $637,700 | $616,600 |
| 2018 | $0 | $1,164,000 | $579,100 | $584,900 |
| 2017 | $0 | $1,098,100 | $546,300 | $551,800 |
| 2016 | -- | $1,026,300 | $510,600 | $515,700 |
| 2015 | -- | $959,200 | $477,200 | $482,000 |
Source: Public Records
Map
Nearby Homes
- 1488 Washington St Unit 1488
- 18 Sewall St
- 40 Sewall St
- 371 Cherry St
- 0 Duncan Rd Unit 72925240
- 318 Austin St Unit A
- 2 Elm St Unit 6
- 2 Elm St Unit 8
- 106 River St Unit 18
- 106 River St Unit 2
- 106 River St Unit 14
- 10 Crescent St Unit 1
- 10 Crescent St Unit 2
- 51 Bourne St
- 17 Gilbert St
- 14 Cottage Place Unit 14
- 17 Crescent St
- 10 Ruane Rd
- 39 Valentine Park
- 41 Kilburn Rd