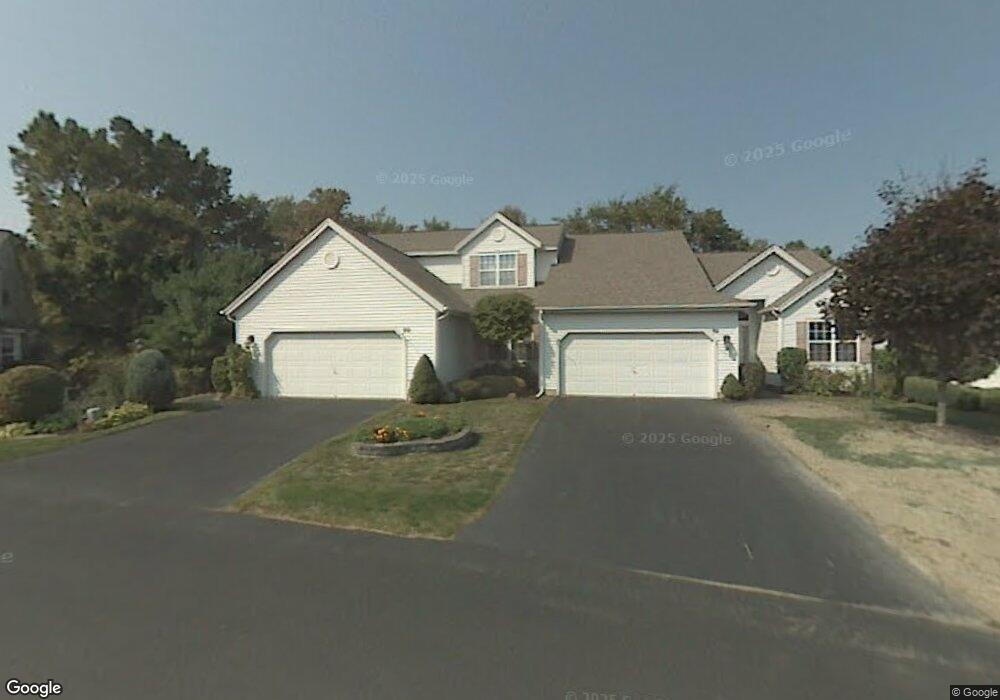
20 Hyland Ct Troy, NY 12182
Lansingburgh NeighborhoodEstimated Value: $331,000 - $351,953
2
Beds
2
Baths
1,710
Sq Ft
$200/Sq Ft
Est. Value
About This Home
This home is located at 20 Hyland Ct, Troy, NY 12182 and is currently estimated at $342,238, approximately $200 per square foot. 20 Hyland Ct is a home located in Rensselaer County with nearby schools including Turnpike Elementary School, Rensselaer Park Elementary School, and Knickerbacker Middle School.
Ownership History
Date
Name
Owned For
Owner Type
Purchase Details
Closed on
Oct 4, 2006
Sold by
Polsinello Richard
Bought by
Figueroa Marainna
Current Estimated Value
Home Financials for this Owner
Home Financials are based on the most recent Mortgage that was taken out on this home.
Original Mortgage
$26,200
Outstanding Balance
$15,703
Interest Rate
6.54%
Mortgage Type
Unknown
Estimated Equity
$326,535
Purchase Details
Closed on
Jul 4, 1997
Sold by
Ruggeri Eileen
Bought by
Polsinello Richard J and Polsinello Leslie
Purchase Details
Closed on
Feb 1, 1996
Sold by
The Michaels Devlp Grp In C
Bought by
Ruggeri Eileen
Create a Home Valuation Report for This Property
The Home Valuation Report is an in-depth analysis detailing your home's value as well as a comparison with similar homes in the area
Home Values in the Area
Average Home Value in this Area
Purchase History
| Date | Buyer | Sale Price | Title Company |
|---|---|---|---|
| Figueroa Marainna | $2,650 | -- | |
| Polsinello Richard J | $144,000 | -- | |
| Ruggeri Eileen | $147,900 | -- |
Source: Public Records
Mortgage History
| Date | Status | Borrower | Loan Amount |
|---|---|---|---|
| Open | Figueroa Marainna | $26,200 | |
| Open | Figueroa Marainna | $212,000 |
Source: Public Records
Tax History Compared to Growth
Tax History
| Year | Tax Paid | Tax Assessment Tax Assessment Total Assessment is a certain percentage of the fair market value that is determined by local assessors to be the total taxable value of land and additions on the property. | Land | Improvement |
|---|---|---|---|---|
| 2024 | $4,250 | $199,000 | $30,000 | $169,000 |
| 2023 | $8,916 | $199,000 | $30,000 | $169,000 |
| 2022 | $4,628 | $199,000 | $30,000 | $169,000 |
| 2021 | $2,266 | $199,000 | $30,000 | $169,000 |
| 2020 | $3,558 | $199,000 | $30,000 | $169,000 |
| 2019 | $4,368 | $199,000 | $30,000 | $169,000 |
| 2018 | $5,630 | $199,000 | $30,000 | $169,000 |
| 2017 | $7,341 | $199,000 | $30,000 | $169,000 |
| 2016 | $7,713 | $199,000 | $30,000 | $169,000 |
| 2015 | -- | $199,000 | $30,000 | $169,000 |
| 2014 | -- | $199,000 | $30,000 | $169,000 |
Source: Public Records
Map
Nearby Homes