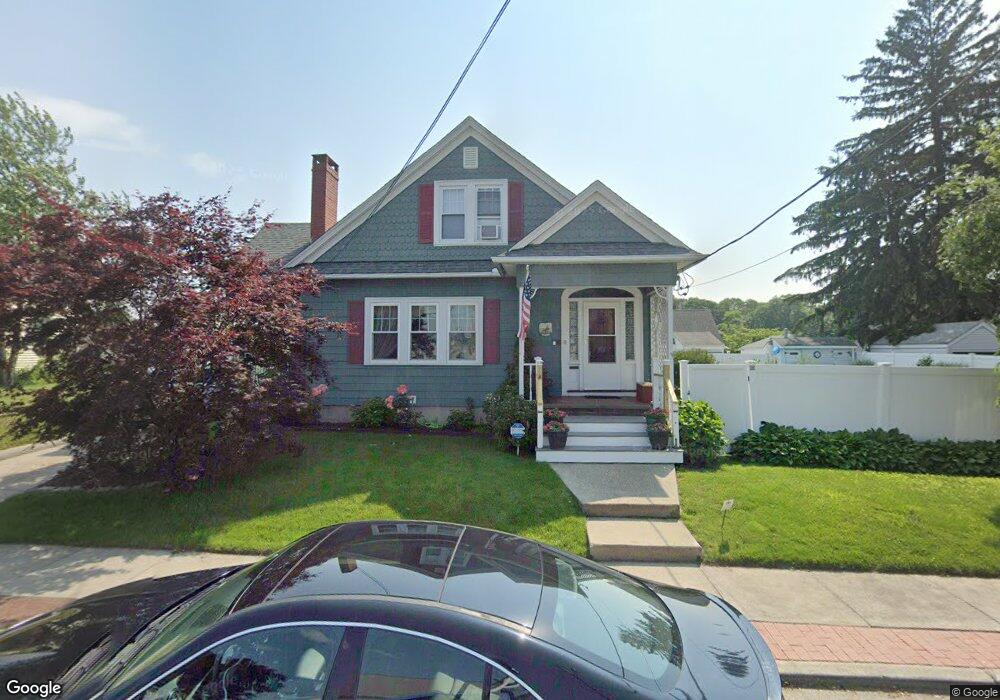
20 Lockmere Rd Cranston, RI 02910
Forest Hills NeighborhoodEstimated Value: $481,000 - $671,000
4
Beds
3
Baths
2,730
Sq Ft
$197/Sq Ft
Est. Value
About This Home
This home is located at 20 Lockmere Rd, Cranston, RI 02910 and is currently estimated at $538,777, approximately $197 per square foot. 20 Lockmere Rd is a home located in Providence County with nearby schools including Woodridge Elementary School, Western Hills Middle School, and Cranston High School West.
Ownership History
Date
Name
Owned For
Owner Type
Purchase Details
Closed on
Jan 4, 2022
Sold by
Mccormick Erica S and Mccormick Ashlyn E
Bought by
Mccormick Matthew R and Mccormick Virginia S
Current Estimated Value
Purchase Details
Closed on
Nov 17, 2021
Sold by
Mccormick Matthew R and Mccormick Virginia S
Bought by
Mccormick Matthew R and Mccormick Virginia S
Purchase Details
Closed on
Aug 25, 1997
Sold by
Carbone John and Carbone Gwenn
Bought by
Mccormick Matthew R and Mccormick Virginia
Create a Home Valuation Report for This Property
The Home Valuation Report is an in-depth analysis detailing your home's value as well as a comparison with similar homes in the area
Home Values in the Area
Average Home Value in this Area
Purchase History
| Date | Buyer | Sale Price | Title Company |
|---|---|---|---|
| Mccormick Matthew R | -- | None Available | |
| Mccormick Matthew R | -- | None Available | |
| Mccormick Matthew R | $125,000 | -- |
Source: Public Records
Mortgage History
| Date | Status | Borrower | Loan Amount |
|---|---|---|---|
| Previous Owner | Mccormick Matthew R | $100,000 | |
| Previous Owner | Mccormick Matthew R | $80,000 | |
| Previous Owner | Mccormick Matthew R | $100,000 |
Source: Public Records
Tax History
| Year | Tax Paid | Tax Assessment Tax Assessment Total Assessment is a certain percentage of the fair market value that is determined by local assessors to be the total taxable value of land and additions on the property. | Land | Improvement |
|---|---|---|---|---|
| 2025 | $5,782 | $416,600 | $100,500 | $316,100 |
| 2024 | $5,670 | $416,600 | $100,500 | $316,100 |
| 2023 | $5,598 | $296,200 | $69,300 | $226,900 |
| 2022 | $5,483 | $296,200 | $69,300 | $226,900 |
| 2021 | $5,332 | $296,200 | $69,300 | $226,900 |
| 2020 | $5,321 | $256,200 | $72,600 | $183,600 |
| 2019 | $5,321 | $256,200 | $72,600 | $183,600 |
| 2018 | $5,198 | $256,200 | $72,600 | $183,600 |
| 2017 | $5,097 | $222,200 | $66,000 | $156,200 |
| 2016 | $4,988 | $222,200 | $66,000 | $156,200 |
| 2015 | $4,988 | $222,200 | $66,000 | $156,200 |
| 2014 | $4,892 | $214,200 | $66,000 | $148,200 |
Source: Public Records
Map
Nearby Homes
Your Personal Tour Guide
Ask me questions while you tour the home.