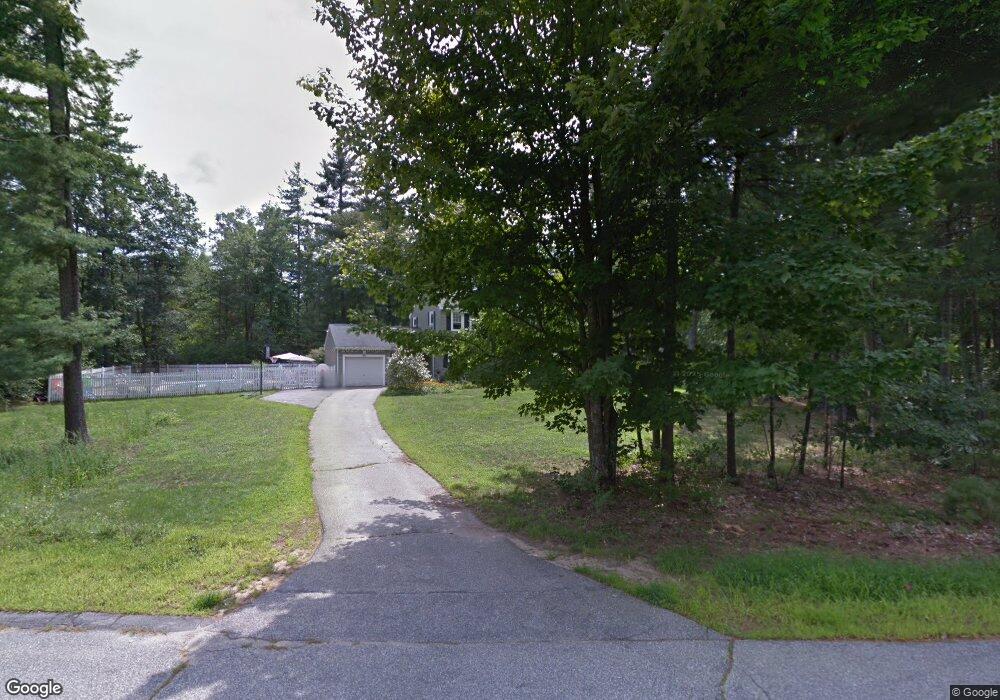
20 Martin Ln Litchfield, NH 03052
Estimated Value: $672,000 - $743,000
3
Beds
3
Baths
2,796
Sq Ft
$254/Sq Ft
Est. Value
About This Home
This home is located at 20 Martin Ln, Litchfield, NH 03052 and is currently estimated at $708,894, approximately $253 per square foot. 20 Martin Ln is a home with nearby schools including Griffin Memorial School and Tabernacle Christian School.
Ownership History
Date
Name
Owned For
Owner Type
Purchase Details
Closed on
Nov 20, 2024
Sold by
Kasprzak David M and Kasprzak Kelly A
Bought by
Kasprzak Kelly A
Current Estimated Value
Home Financials for this Owner
Home Financials are based on the most recent Mortgage that was taken out on this home.
Original Mortgage
$266,200
Outstanding Balance
$263,648
Interest Rate
6.32%
Mortgage Type
Stand Alone Refi Refinance Of Original Loan
Estimated Equity
$445,246
Purchase Details
Closed on
Apr 1, 2003
Sold by
Migneault David P and Migneault Cheryl P
Bought by
Kasprzak David M and Kasprzak Kelly A
Home Financials for this Owner
Home Financials are based on the most recent Mortgage that was taken out on this home.
Original Mortgage
$260,900
Interest Rate
5.91%
Create a Home Valuation Report for This Property
The Home Valuation Report is an in-depth analysis detailing your home's value as well as a comparison with similar homes in the area
Home Values in the Area
Average Home Value in this Area
Purchase History
| Date | Buyer | Sale Price | Title Company |
|---|---|---|---|
| Kasprzak Kelly A | -- | None Available | |
| Kasprzak Kelly A | -- | None Available | |
| Kasprzak David M | $265,000 | -- | |
| Kasprzak David M | $265,000 | -- |
Source: Public Records
Mortgage History
| Date | Status | Borrower | Loan Amount |
|---|---|---|---|
| Open | Kasprzak Kelly A | $266,200 | |
| Closed | Kasprzak Kelly A | $266,200 | |
| Previous Owner | Kasprzak David M | $223,900 | |
| Previous Owner | Kasprzak David M | $32,000 | |
| Previous Owner | Kasprzak David M | $45,000 | |
| Previous Owner | Kasprzak David M | $260,900 |
Source: Public Records
Tax History Compared to Growth
Tax History
| Year | Tax Paid | Tax Assessment Tax Assessment Total Assessment is a certain percentage of the fair market value that is determined by local assessors to be the total taxable value of land and additions on the property. | Land | Improvement |
|---|---|---|---|---|
| 2024 | $9,868 | $474,900 | $163,500 | $311,400 |
| 2023 | $9,944 | $474,900 | $163,500 | $311,400 |
| 2022 | $9,037 | $474,900 | $163,500 | $311,400 |
| 2021 | $8,757 | $474,900 | $163,500 | $311,400 |
| 2020 | $8,824 | $474,900 | $163,500 | $311,400 |
| 2019 | $8,602 | $363,700 | $130,700 | $233,000 |
| 2017 | $8,036 | $357,300 | $130,700 | $226,600 |
| 2016 | $7,659 | $354,600 | $130,700 | $223,900 |
| 2015 | $2,827 | $138,700 | $130,700 | $8,000 |
| 2014 | $5,680 | $274,400 | $122,500 | $151,900 |
| 2013 | $5,644 | $274,400 | $122,500 | $151,900 |
Source: Public Records
Map
Nearby Homes
- 22 Cardinal Ln
- 12 Louise Dr
- 31 Page Rd Unit 20
- 11 Rotterdam Dr
- 18 Tallarico St Unit Lot 23
- 36 Charles Bancroft Hwy
- 11 Bradford Ln
- 5 Talent Rd Unit 29-2
- 7 Talent Rd Unit 7/29-2
- 1 Cobbler Ct
- 8 Acadia Dr
- 7A Kingston Way Unit A
- 3 Acadia Dr Unit 2-7
- 9 Plaza Ave
- 4 Sunset Dr Unit A
- 27 Alvirne Dr
- 4 Quincy Rd
- 4 Quincy Rd Unit A
- 20 Locke Mill Dr
- 19 Dixon Dr