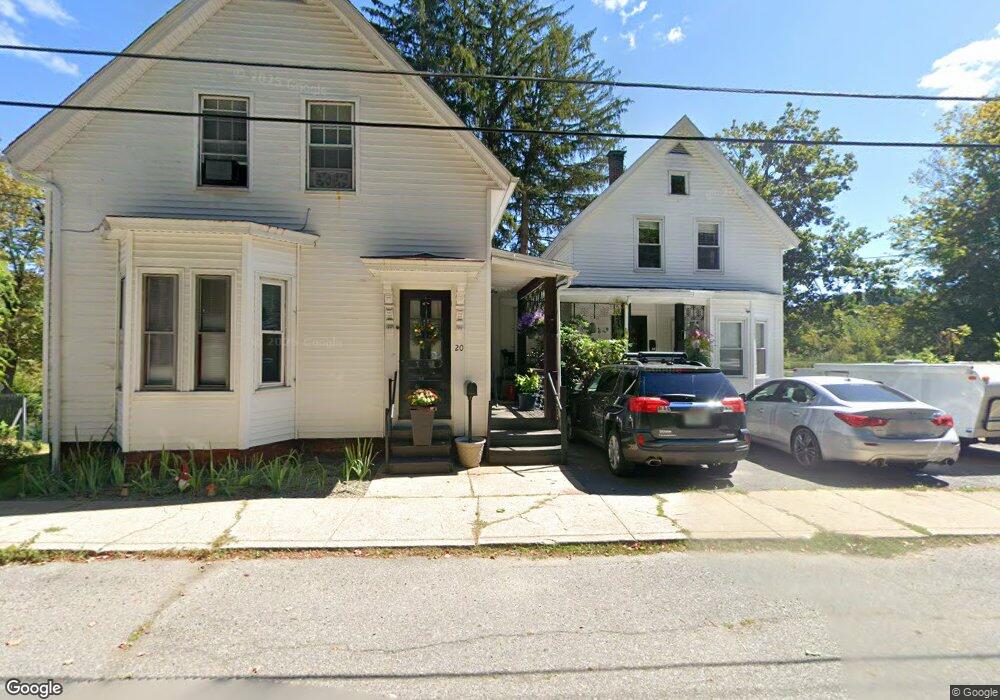
20 Mill St Unit 22 Gardner, MA 01440
Estimated Value: $334,000 - $367,000
4
Beds
3
Baths
1,865
Sq Ft
$190/Sq Ft
Est. Value
About This Home
This home is located at 20 Mill St Unit 22, Gardner, MA 01440 and is currently estimated at $354,183, approximately $189 per square foot. 20 Mill St Unit 22 is a home located in Worcester County with nearby schools including Gardner High School, Holy Family Academy, and Wachusett Hills Christian School.
Ownership History
Date
Name
Owned For
Owner Type
Purchase Details
Closed on
Jan 14, 2000
Sold by
Packard Ronald P
Bought by
Hanmore Alan and Hanmore Rose M
Current Estimated Value
Purchase Details
Closed on
May 26, 1999
Sold by
Payne Vernadean and Payne Samuel L
Bought by
Packard Ronald P
Create a Home Valuation Report for This Property
The Home Valuation Report is an in-depth analysis detailing your home's value as well as a comparison with similar homes in the area
Home Values in the Area
Average Home Value in this Area
Purchase History
| Date | Buyer | Sale Price | Title Company |
|---|---|---|---|
| Hanmore Alan | $85,000 | -- | |
| Packard Ronald P | $50,000 | -- |
Source: Public Records
Mortgage History
| Date | Status | Borrower | Loan Amount |
|---|---|---|---|
| Open | Packard Ronald P | $10,000 | |
| Open | Packard Ronald P | $80,000 | |
| Closed | Packard Ronald P | $20,000 |
Source: Public Records
Tax History Compared to Growth
Tax History
| Year | Tax Paid | Tax Assessment Tax Assessment Total Assessment is a certain percentage of the fair market value that is determined by local assessors to be the total taxable value of land and additions on the property. | Land | Improvement |
|---|---|---|---|---|
| 2025 | $37 | $256,200 | $67,200 | $189,000 |
| 2024 | $3,674 | $245,100 | $61,100 | $184,000 |
| 2023 | $3,532 | $219,000 | $60,200 | $158,800 |
| 2022 | $3,303 | $177,700 | $45,600 | $132,100 |
| 2021 | $3,130 | $156,200 | $39,600 | $116,600 |
| 2020 | $3,000 | $152,000 | $39,600 | $112,400 |
| 2019 | $2,920 | $145,000 | $39,600 | $105,400 |
| 2018 | $2,511 | $123,900 | $39,600 | $84,300 |
| 2017 | $2,451 | $119,700 | $39,600 | $80,100 |
| 2016 | $2,391 | $116,800 | $39,600 | $77,200 |
| 2015 | $2,334 | $116,800 | $39,600 | $77,200 |
| 2014 | $2,412 | $127,800 | $50,600 | $77,200 |
Source: Public Records
Map
Nearby Homes