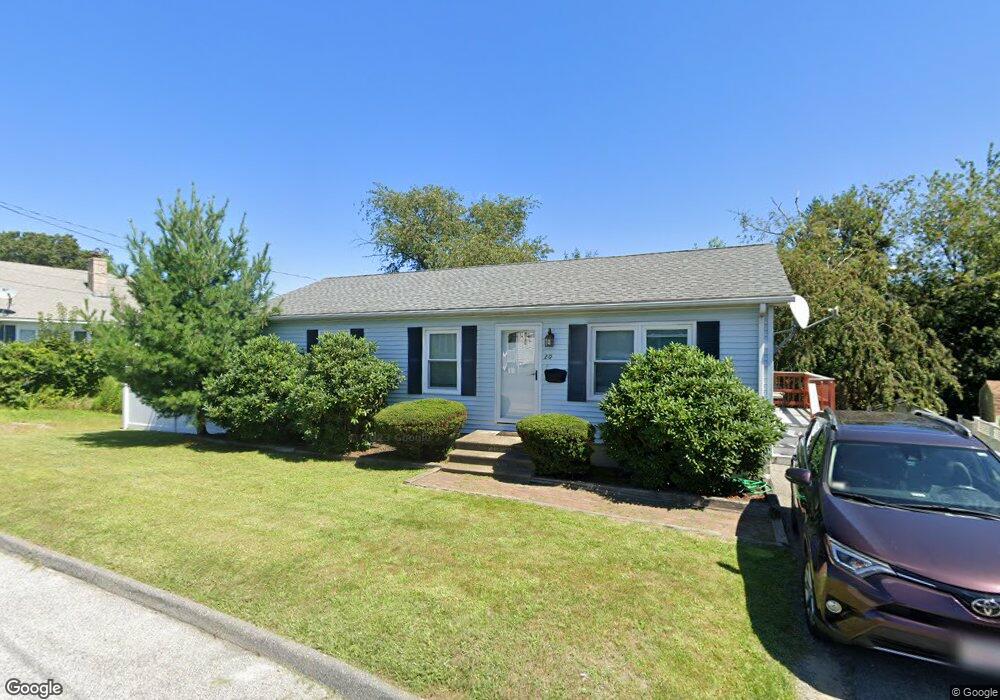
20 Mount Ave Worcester, MA 01606
Greendale NeighborhoodEstimated Value: $367,000 - $414,077
3
Beds
2
Baths
1,008
Sq Ft
$385/Sq Ft
Est. Value
About This Home
This home is located at 20 Mount Ave, Worcester, MA 01606 and is currently estimated at $388,269, approximately $385 per square foot. 20 Mount Ave is a home located in Worcester County with nearby schools including Norrback Avenue Elementary School, Jacob Hiatt Magnet School, and Chandler Magnet.
Ownership History
Date
Name
Owned For
Owner Type
Purchase Details
Closed on
Nov 27, 1996
Sold by
White Rodney A
Bought by
Essien Imeh I and Essien Mercy
Current Estimated Value
Home Financials for this Owner
Home Financials are based on the most recent Mortgage that was taken out on this home.
Original Mortgage
$88,825
Interest Rate
7.82%
Mortgage Type
Purchase Money Mortgage
Create a Home Valuation Report for This Property
The Home Valuation Report is an in-depth analysis detailing your home's value as well as a comparison with similar homes in the area
Home Values in the Area
Average Home Value in this Area
Purchase History
| Date | Buyer | Sale Price | Title Company |
|---|---|---|---|
| Essien Imeh I | $93,500 | -- |
Source: Public Records
Mortgage History
| Date | Status | Borrower | Loan Amount |
|---|---|---|---|
| Open | Essien Imeh I | $126,000 | |
| Closed | Essien Imeh I | $88,825 | |
| Previous Owner | Essien Imeh I | $80,800 | |
| Previous Owner | Essien Imeh I | $84,700 |
Source: Public Records
Tax History
| Year | Tax Paid | Tax Assessment Tax Assessment Total Assessment is a certain percentage of the fair market value that is determined by local assessors to be the total taxable value of land and additions on the property. | Land | Improvement |
|---|---|---|---|---|
| 2025 | $4,764 | $361,200 | $117,700 | $243,500 |
| 2024 | $4,667 | $339,400 | $117,700 | $221,700 |
| 2023 | $4,510 | $314,500 | $102,400 | $212,100 |
| 2022 | $3,993 | $262,500 | $81,900 | $180,600 |
| 2021 | $3,824 | $234,900 | $65,500 | $169,400 |
| 2020 | $3,742 | $220,100 | $65,500 | $154,600 |
| 2019 | $3,514 | $195,200 | $58,900 | $136,300 |
| 2018 | $3,413 | $180,500 | $58,900 | $121,600 |
| 2017 | $3,467 | $180,400 | $58,900 | $121,500 |
| 2016 | $3,372 | $163,600 | $42,900 | $120,700 |
| 2015 | $3,283 | $163,600 | $42,900 | $120,700 |
| 2014 | $3,197 | $163,600 | $42,900 | $120,700 |
Source: Public Records
Map
Nearby Homes
Your Personal Tour Guide
Ask me questions while you tour the home.