K
Seller's Agent in 2016
Kristie Lindquist
RE/MAX
Estimated Value: $542,000 - $607,000
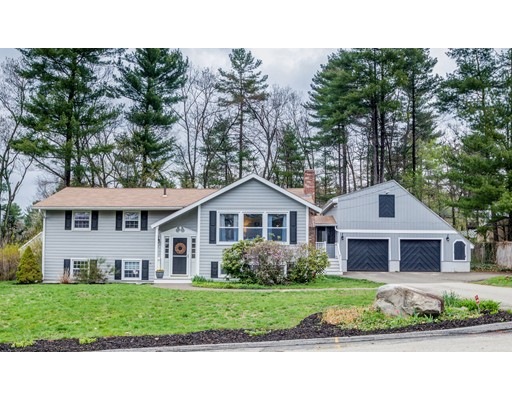
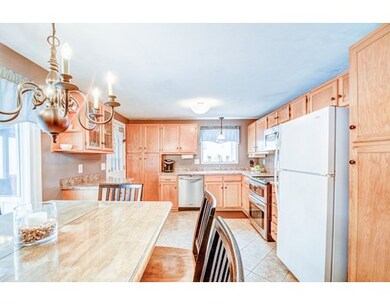
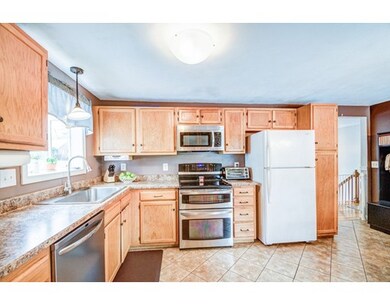
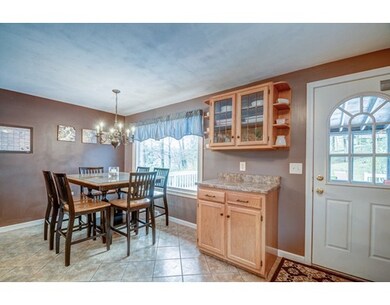
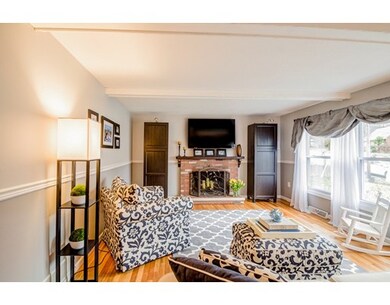
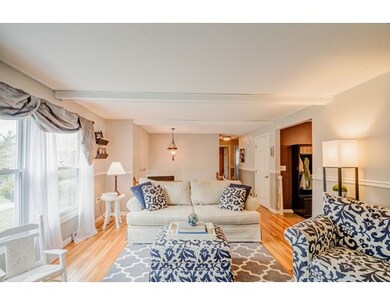
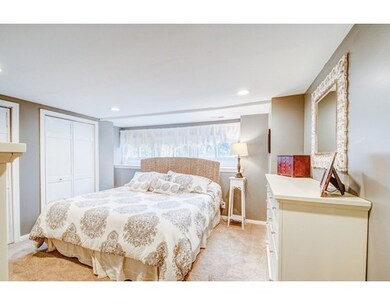
Welcome home to this charming 4 bedroom, 1 ¾ bath, Split Level Home in a sought after South Nashua Neighborhood! Situated on a half acre lot, with a 2 car attached garage, this is a commuter's dream just off of Exit 4. The first floor offers gleaming hardwood flooring and tile throughout, 3 bedrooms, central A/C and a beautifully updated full bath. The eat-in kitchen leads out to a screened-in porch and deck overlooking the backyard. The finished lower level features an oversized family room, ¾ bath, a 4th bedroom, storage space and new carpet. This is a must see, move in ready home!!
Last Agent to Sell the Property
Kristie Lindquist
RE/MAX Innovative Properties Listed on: 05/05/2016

Home Type
Single Family
Est. Annual Taxes
$8,465
Year Built
1968
Lot Details
0
| Date | Buyer | Sale Price | Title Company |
|---|---|---|---|
| Sheridan Petruccelli R | -- | -- | |
| Sheridan Laura K | $295,000 | -- | |
| Falzarano 3Rd Kate K | $295,000 | -- |
| Date | Status | Borrower | Loan Amount |
|---|---|---|---|
| Previous Owner | Sheridan Laura K | $266,000 | |
| Previous Owner | Falzarano 3Rd Kate K | $261,625 | |
| Previous Owner | Falzarano 3Rd Kate K | $270,000 | |
| Previous Owner | Falzarano 3Rd Kate K | $275,250 |
| Date | Event | Price | List to Sale | Price per Sq Ft |
|---|---|---|---|---|
| 07/14/2016 07/14/16 | Sold | $295,000 | -1.6% | $155 / Sq Ft |
| 05/09/2016 05/09/16 | Pending | -- | -- | -- |
| 05/05/2016 05/05/16 | For Sale | $299,900 | -- | $158 / Sq Ft |
| Year | Tax Paid | Tax Assessment Tax Assessment Total Assessment is a certain percentage of the fair market value that is determined by local assessors to be the total taxable value of land and additions on the property. | Land | Improvement |
|---|---|---|---|---|
| 2024 | $8,465 | $532,400 | $175,200 | $357,200 |
| 2023 | $7,872 | $431,800 | $140,200 | $291,600 |
| 2022 | $7,803 | $431,800 | $140,200 | $291,600 |
| 2021 | $7,012 | $302,000 | $93,400 | $208,600 |
| 2020 | $6,828 | $302,000 | $93,400 | $208,600 |
| 2019 | $6,572 | $302,000 | $93,400 | $208,600 |
| 2018 | $6,405 | $302,000 | $93,400 | $208,600 |
| 2017 | $6,257 | $242,600 | $75,500 | $167,100 |
| 2016 | $5,957 | $237,600 | $75,500 | $162,100 |
| 2015 | $5,828 | $237,600 | $75,500 | $162,100 |
| 2014 | $5,685 | $236,400 | $75,500 | $160,900 |
K
Seller's Agent in 2016
Kristie Lindquist
RE/MAX
Buyer's Agent in 2016
Gagnon Lindquist Team
RE/MAX
34 Total Sales
Source: MLS Property Information Network (MLS PIN)
MLS Number: 72000375
APN: NASH-000000-000000-000411C
Disclaimer: Certain information contained herein is derived from information provided by parties other than Homes.com. All information provided is deemed reliable, but is not guaranteed to be accurate and should be independently verified.
![]() The property listing data and information, or the Images, set forth herein were provided to MLS Property Information Network, Inc. from third party sources, including sellers, lessors and public records, and were compiled by MLS Property Information Network, Inc. The property listing data and information, and the Images, are for the personal, non-commercial use of consumers having a good faith interest in purchasing or leasing listed properties of the type displayed to them and may not be used for any purpose other than to identify prospective properties which such consumers may have a good faith interest in purchasing or leasing. MLS Property Information Network, Inc. and its subscribers disclaim any and all representations and warranties as to the accuracy of the property listing data and information, or as to the accuracy of any of the Images, set forth herein.
The property listing data and information, or the Images, set forth herein were provided to MLS Property Information Network, Inc. from third party sources, including sellers, lessors and public records, and were compiled by MLS Property Information Network, Inc. The property listing data and information, and the Images, are for the personal, non-commercial use of consumers having a good faith interest in purchasing or leasing listed properties of the type displayed to them and may not be used for any purpose other than to identify prospective properties which such consumers may have a good faith interest in purchasing or leasing. MLS Property Information Network, Inc. and its subscribers disclaim any and all representations and warranties as to the accuracy of the property listing data and information, or as to the accuracy of any of the Images, set forth herein.