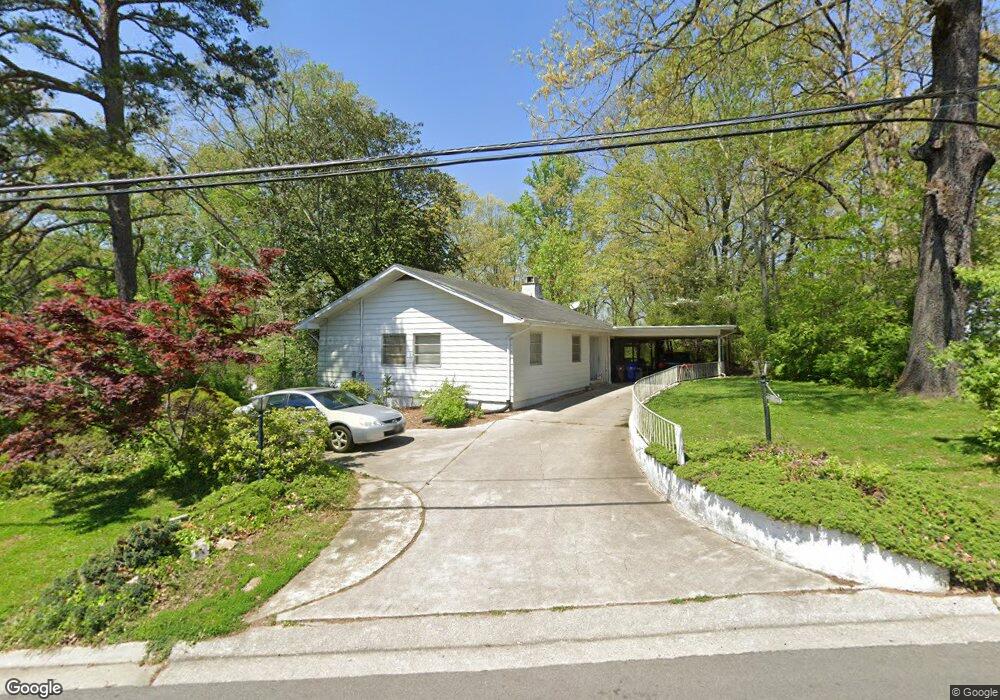
20 Outer Dr Oak Ridge, TN 37830
Estimated Value: $314,634 - $368,000
3
Beds
2
Baths
1,757
Sq Ft
$193/Sq Ft
Est. Value
About This Home
This home is located at 20 Outer Dr, Oak Ridge, TN 37830 and is currently estimated at $339,909, approximately $193 per square foot. 20 Outer Dr is a home located in Anderson County with nearby schools including Glenwood Elementary, Jefferson Middle School, and Oak Ridge High School.
Ownership History
Date
Name
Owned For
Owner Type
Purchase Details
Closed on
Nov 16, 2016
Sold by
Clayton Frank L and Testament Of Franklin Delano C
Bought by
Clayton Lozano Catrina
Current Estimated Value
Purchase Details
Closed on
Nov 14, 2016
Sold by
Clayton Franklin D
Bought by
Lozano Catrina Clayton-
Purchase Details
Closed on
May 25, 2006
Sold by
Hartman Kimberly K
Bought by
Clayton Franklin D
Home Financials for this Owner
Home Financials are based on the most recent Mortgage that was taken out on this home.
Original Mortgage
$36,000
Interest Rate
6.41%
Purchase Details
Closed on
Nov 12, 2002
Sold by
Wickham Virginia and Wickham Lee P
Bought by
Hartman Kimberly K
Home Financials for this Owner
Home Financials are based on the most recent Mortgage that was taken out on this home.
Original Mortgage
$114,500
Interest Rate
5.88%
Purchase Details
Closed on
Nov 12, 1997
Sold by
Struxness Edward G
Bought by
Heck Richard
Purchase Details
Closed on
Mar 15, 1991
Bought by
Struxness Edward G and Struxness Wife Thelma P
Create a Home Valuation Report for This Property
The Home Valuation Report is an in-depth analysis detailing your home's value as well as a comparison with similar homes in the area
Home Values in the Area
Average Home Value in this Area
Purchase History
| Date | Buyer | Sale Price | Title Company |
|---|---|---|---|
| Clayton Lozano Catrina | -- | None Available | |
| Lozano Catrina Clayton- | -- | -- | |
| Clayton Franklin D | $135,900 | -- | |
| Hartman Kimberly K | $115,000 | -- | |
| Heck Richard | $94,000 | -- | |
| Struxness Edward G | $78,000 | -- |
Source: Public Records
Mortgage History
| Date | Status | Borrower | Loan Amount |
|---|---|---|---|
| Previous Owner | Struxness Edward G | $36,000 | |
| Previous Owner | Struxness Edward G | $114,500 |
Source: Public Records
Tax History Compared to Growth
Tax History
| Year | Tax Paid | Tax Assessment Tax Assessment Total Assessment is a certain percentage of the fair market value that is determined by local assessors to be the total taxable value of land and additions on the property. | Land | Improvement |
|---|---|---|---|---|
| 2024 | $1,007 | $41,000 | $6,750 | $34,250 |
| 2023 | $1,007 | $41,000 | $0 | $0 |
| 2022 | $1,956 | $41,000 | $6,750 | $34,250 |
| 2021 | $1,956 | $41,000 | $6,750 | $34,250 |
| 2020 | $1,697 | $41,000 | $6,750 | $34,250 |
| 2019 | $1,737 | $33,050 | $6,325 | $26,725 |
| 2018 | $1,696 | $33,050 | $6,325 | $26,725 |
| 2017 | $1,690 | $33,050 | $6,325 | $26,725 |
| 2016 | $1,690 | $33,050 | $6,325 | $26,725 |
| 2015 | -- | $33,200 | $6,325 | $26,875 |
| 2014 | -- | $33,050 | $6,325 | $26,725 |
| 2013 | -- | $37,575 | $0 | $0 |
Source: Public Records
Map
Nearby Homes
- 27 Outer Dr
- 100 Everest Cir
- 102 Oglethorpe Ln
- 516 Delaware Ave
- 115 Euclid Cir
- 104 Ogden Cir
- 102 Decatur Rd
- 1013 Oliver Springs Hwy
- 574 Bacon Springs Ln
- 130 Andover Cir
- 386 East Dr
- 103 Albany Rd
- 304 Firestone Rd
- 119 Aspen Ln
- 187 Tacoma Rd
- 113 Tacoma Rd
- 114 Orange Ln
- 112 Georgia Ave
- 107 Townsend Rd
- 168 Powder Mill Ln