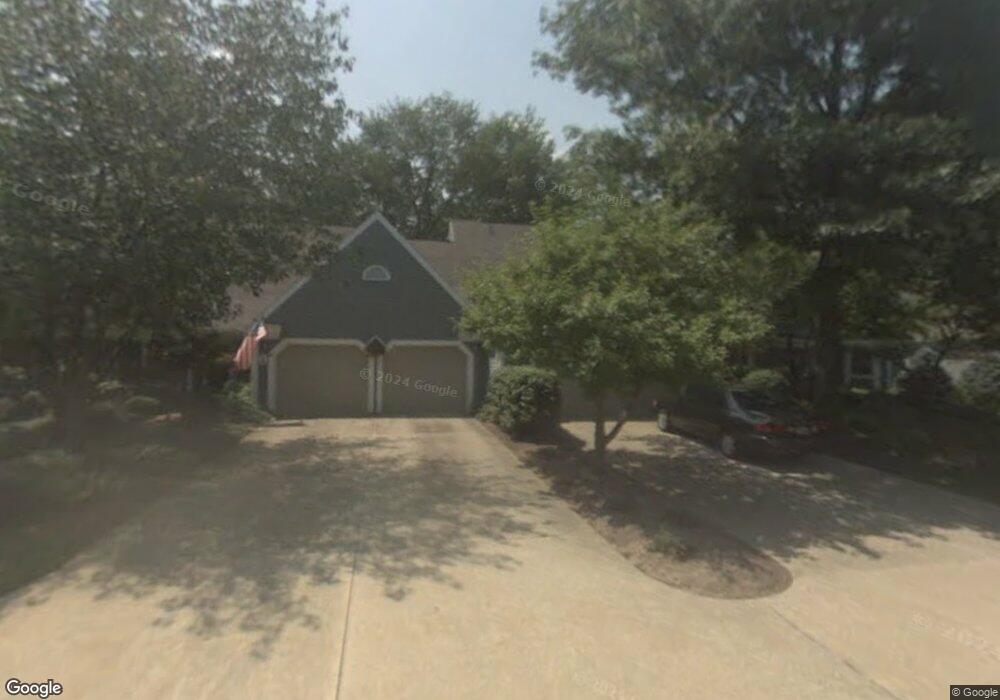
20 Pheasant Run Dr Unit 20 Chagrin Falls, OH 44022
Estimated Value: $443,930 - $490,000
2
Beds
3
Baths
1,605
Sq Ft
$292/Sq Ft
Est. Value
About This Home
This home is located at 20 Pheasant Run Dr Unit 20, Chagrin Falls, OH 44022 and is currently estimated at $468,733, approximately $292 per square foot. 20 Pheasant Run Dr Unit 20 is a home located in Cuyahoga County with nearby schools including Gurney Elementary School, Chagrin Falls Intermediate Elementary School, and Chagrin Falls Middle School.
Ownership History
Date
Name
Owned For
Owner Type
Purchase Details
Closed on
Jun 15, 2009
Sold by
Barrett Tracey L
Bought by
Rouru Patricia A
Current Estimated Value
Home Financials for this Owner
Home Financials are based on the most recent Mortgage that was taken out on this home.
Original Mortgage
$124,000
Outstanding Balance
$78,598
Interest Rate
4.83%
Mortgage Type
Unknown
Estimated Equity
$390,135
Purchase Details
Closed on
Nov 21, 1997
Sold by
Hughes William H
Bought by
Barrett Tracey L
Home Financials for this Owner
Home Financials are based on the most recent Mortgage that was taken out on this home.
Original Mortgage
$183,200
Interest Rate
7.38%
Mortgage Type
Balloon
Purchase Details
Closed on
Jun 18, 1994
Sold by
Betty Cope Trst
Bought by
Hughes William H and Hughes Susan C
Purchase Details
Closed on
Jul 7, 1993
Sold by
Henry Fred H
Bought by
Betty Cope Trustee Under
Purchase Details
Closed on
Jan 1, 1987
Bought by
Henry Fred H
Create a Home Valuation Report for This Property
The Home Valuation Report is an in-depth analysis detailing your home's value as well as a comparison with similar homes in the area
Home Values in the Area
Average Home Value in this Area
Purchase History
| Date | Buyer | Sale Price | Title Company |
|---|---|---|---|
| Rouru Patricia A | $249,000 | Barristers Title Agency | |
| Barrett Tracey L | $229,000 | -- | |
| Hughes William H | $179,000 | -- | |
| Betty Cope Trustee Under | -- | -- | |
| Henry Fred H | -- | -- |
Source: Public Records
Mortgage History
| Date | Status | Borrower | Loan Amount |
|---|---|---|---|
| Open | Rouru Patricia A | $124,000 | |
| Previous Owner | Barrett Tracey L | $183,200 |
Source: Public Records
Tax History Compared to Growth
Tax History
| Year | Tax Paid | Tax Assessment Tax Assessment Total Assessment is a certain percentage of the fair market value that is determined by local assessors to be the total taxable value of land and additions on the property. | Land | Improvement |
|---|---|---|---|---|
| 2024 | $8,484 | $137,585 | $13,755 | $123,830 |
| 2023 | $7,623 | $107,100 | $10,710 | $96,390 |
| 2022 | $8,063 | $107,100 | $10,710 | $96,390 |
| 2021 | $8,028 | $107,100 | $10,710 | $96,390 |
| 2020 | $7,630 | $93,940 | $9,380 | $84,560 |
| 2019 | $7,515 | $268,400 | $26,800 | $241,600 |
| 2018 | $7,472 | $93,940 | $9,380 | $84,560 |
| 2017 | $7,474 | $88,900 | $9,590 | $79,310 |
| 2016 | $6,710 | $88,900 | $9,590 | $79,310 |
| 2015 | $6,695 | $88,900 | $9,590 | $79,310 |
| 2014 | $6,695 | $87,160 | $9,420 | $77,740 |
Source: Public Records
Map
Nearby Homes
- 7320 Ober Ln
- 9 E Carriage Dr
- 219 S Main St
- 213 S Main St
- 207 S Main St
- 225 S Main St
- V/L Fairview Rd
- 110 Emilia Ct
- 808 Bell Rd
- 80 South St
- 114 Mapleridge Rd
- 188 Cleveland St
- 7481 Chagrin Rd
- 7637 Birchmont Dr
- 156 S Franklin St
- 16685 Heatherwood Ln
- 15915 Laurel Rd
- 7560 Chagrin Rd
- 81 Hall St
- 7658 Blackford Dr
- 10 Pheasant Run Dr Unit 10
- 30 Pheasant Run Dr Unit 130
- 40 Pheasant Run Dr Unit 40
- 460 E Washington St
- 50 Pheasant Run Dr
- 60 Pheasant Run Dr Unit 60
- 456 E Washington St
- 70 Pheasant Run Dr
- 80 Pheasant Run Dr
- 280 Pheasant Run Dr Unit 280
- 55 Pheasant Run Dr
- 90 Pheasant Run Dr Unit 90
- 270 Pheasant Run Dr
- 270 Pheasant Run Dr Unit 270C
- 260 Pheasant Run Dr Unit 260
- 265 Pheasant Run Dr
- 65 Pheasant Run Dr Unit 65
- 250 Pheasant Run Dr Unit 250C
- 100 Pheasant Run Dr Unit 100
- 446 E Washington St