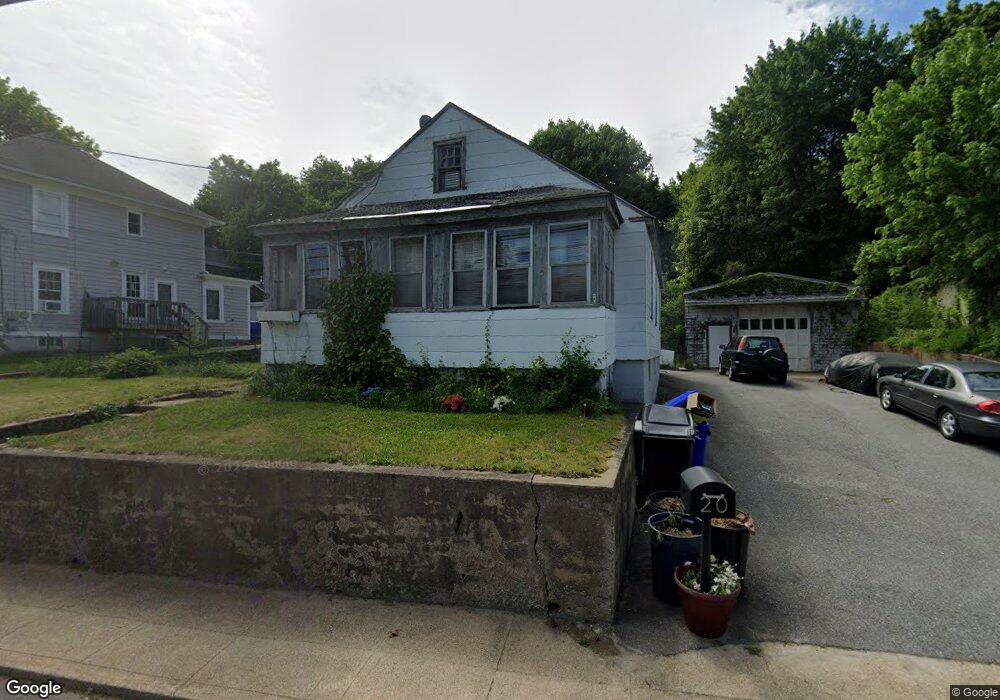
20 Phenix Ave West Warwick, RI 02893
Lippitt-Harris NeighborhoodEstimated Value: $337,000 - $431,325
2
Beds
1
Bath
884
Sq Ft
$436/Sq Ft
Est. Value
About This Home
This home is located at 20 Phenix Ave, West Warwick, RI 02893 and is currently estimated at $385,331, approximately $435 per square foot. 20 Phenix Ave is a home located in Kent County with nearby schools including West Warwick High School and St Joseph School.
Ownership History
Date
Name
Owned For
Owner Type
Purchase Details
Closed on
May 23, 2023
Sold by
West Warwick Town Of and Ponte
Bought by
Jordan Realty Rigp
Current Estimated Value
Purchase Details
Closed on
Sep 12, 2022
Sold by
Gierhart William
Bought by
Jerez Maribel C and Crisotomo Hobi F
Create a Home Valuation Report for This Property
The Home Valuation Report is an in-depth analysis detailing your home's value as well as a comparison with similar homes in the area
Home Values in the Area
Average Home Value in this Area
Purchase History
| Date | Buyer | Sale Price | Title Company |
|---|---|---|---|
| Jordan Realty Rigp | $1,697 | None Available | |
| Jerez Maribel C | $370,000 | None Available |
Source: Public Records
Tax History
| Year | Tax Paid | Tax Assessment Tax Assessment Total Assessment is a certain percentage of the fair market value that is determined by local assessors to be the total taxable value of land and additions on the property. | Land | Improvement |
|---|---|---|---|---|
| 2025 | $3,117 | $218,100 | $75,800 | $142,300 |
| 2024 | $3,147 | $168,400 | $71,500 | $96,900 |
| 2023 | $3,085 | $168,400 | $71,500 | $96,900 |
| 2022 | $3,038 | $168,400 | $71,500 | $96,900 |
| 2021 | $2,905 | $126,300 | $54,700 | $71,600 |
| 2020 | $2,905 | $126,300 | $54,700 | $71,600 |
| 2019 | $3,703 | $126,300 | $54,700 | $71,600 |
| 2018 | $2,601 | $98,500 | $47,100 | $51,400 |
| 2017 | $2,592 | $98,500 | $47,100 | $51,400 |
| 2016 | $2,545 | $98,500 | $47,100 | $51,400 |
| 2015 | $2,526 | $97,300 | $47,100 | $50,200 |
| 2014 | $2,470 | $97,300 | $47,100 | $50,200 |
Source: Public Records
Map
Nearby Homes