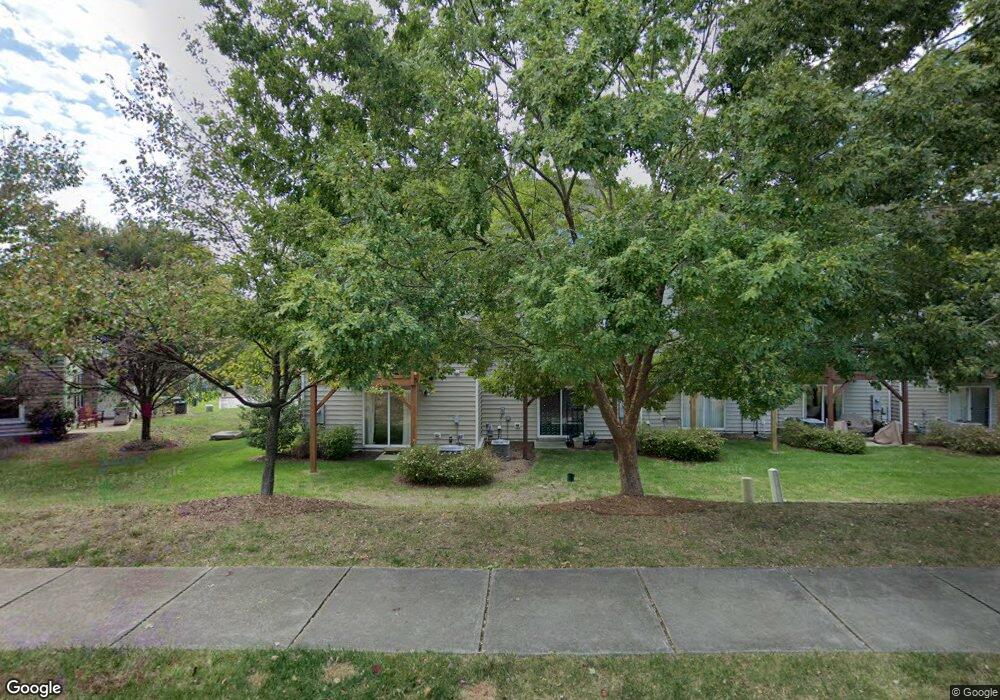
20 Prairie View Ct Durham, NC 27703
Eastern Durham NeighborhoodEstimated Value: $319,000 - $367,000
3
Beds
4
Baths
2,024
Sq Ft
$174/Sq Ft
Est. Value
About This Home
This home is located at 20 Prairie View Ct, Durham, NC 27703 and is currently estimated at $351,961, approximately $173 per square foot. 20 Prairie View Ct is a home located in Durham County with nearby schools including Spring Valley Elementary School, John W Neal Middle School, and Southern School of Energy & Sustainability.
Ownership History
Date
Name
Owned For
Owner Type
Purchase Details
Closed on
Apr 3, 2020
Sold by
Opendoor Property Trust
Bought by
Wright Brittri
Current Estimated Value
Home Financials for this Owner
Home Financials are based on the most recent Mortgage that was taken out on this home.
Original Mortgage
$222,300
Outstanding Balance
$196,931
Interest Rate
3.4%
Mortgage Type
New Conventional
Estimated Equity
$155,030
Purchase Details
Closed on
Oct 18, 2019
Sold by
Dietz Jessica Lynn and Dietz Justin A
Bought by
Opendoor Property Trust I
Purchase Details
Closed on
Mar 11, 2014
Sold by
The Drees Co
Bought by
Cochran Jessica Lynn
Home Financials for this Owner
Home Financials are based on the most recent Mortgage that was taken out on this home.
Original Mortgage
$172,000
Interest Rate
4.25%
Mortgage Type
Adjustable Rate Mortgage/ARM
Purchase Details
Closed on
Jul 29, 2013
Sold by
Mrec Brightleaf Llc
Bought by
The Drees Company and The Drees Homes Co
Create a Home Valuation Report for This Property
The Home Valuation Report is an in-depth analysis detailing your home's value as well as a comparison with similar homes in the area
Home Values in the Area
Average Home Value in this Area
Purchase History
| Date | Buyer | Sale Price | Title Company |
|---|---|---|---|
| Wright Brittri | $234,000 | None Available | |
| Opendoor Property Trust I | $240,500 | None Available | |
| Cochran Jessica Lynn | $172,000 | None Available | |
| The Drees Company | $125,000 | None Available |
Source: Public Records
Mortgage History
| Date | Status | Borrower | Loan Amount |
|---|---|---|---|
| Open | Wright Brittri | $222,300 | |
| Previous Owner | Cochran Jessica Lynn | $172,000 |
Source: Public Records
Tax History
| Year | Tax Paid | Tax Assessment Tax Assessment Total Assessment is a certain percentage of the fair market value that is determined by local assessors to be the total taxable value of land and additions on the property. | Land | Improvement |
|---|---|---|---|---|
| 2025 | $3,900 | $393,384 | $75,000 | $318,384 |
| 2024 | $3,225 | $231,167 | $40,000 | $191,167 |
| 2023 | $3,028 | $231,167 | $40,000 | $191,167 |
| 2022 | $2,959 | $231,167 | $40,000 | $191,167 |
| 2021 | $2,945 | $231,167 | $40,000 | $191,167 |
| 2020 | $2,875 | $231,167 | $40,000 | $191,167 |
| 2019 | $2,875 | $231,167 | $40,000 | $191,167 |
| 2018 | $2,398 | $176,757 | $30,000 | $146,757 |
| 2017 | $2,380 | $176,757 | $30,000 | $146,757 |
| 2016 | $2,300 | $176,757 | $30,000 | $146,757 |
| 2015 | $2,505 | $180,986 | $36,800 | $144,186 |
| 2014 | $2,505 | $180,986 | $36,800 | $144,186 |
Source: Public Records
Map
Nearby Homes
- 408 Timpson Ave
- 14 Prairie View Ct
- 232 Cross Blossom Rd
- 1918 Woodsdale Dr
- 2103 Woodsdale Dr
- 1808 Pennypacker Ln
- 3004 Prospect Pkwy
- 809 Doggard Ln
- 1010 Lubbock Ln
- 2 Alyea Ct
- 3317 Prospect Pkwy
- 1607 Eagle Lodge Ln
- 3338 Prospect Pkwy
- 1104 San Antonio Blvd
- 3337 Prospect Pkwy
- 1602 Eagle Lodge Ln
- 1038 Constellation Cir
- 1052 Constellation Cir
- 1050 Constellation Cir
- 1041 Constellation Cir
- 18 Prairie View Ct
- 22 Prairie View Ct
- 16 Prairie View Ct
- 502 Timpson Ave Unit 82
- 502 Timpson Ave
- 504 Timpson Ave
- 12 Prairie View Ct
- 506 Timpson Ave
- 508 Timpson Ave
- 508 Timpson Ave Unit 79
- 10 Prairie View Ct
- 416 Timpson Ave
- 19 Prairie View Ct
- 17 Prairie View Ct
- 15 Prairie View Ct
- 21 Prairie View Ct
- 414 Timpson Ave
- 13 Prairie View Ct
- 512 Timpson Ave Unit 78
- 8 Prairie View Ct
Your Personal Tour Guide
Ask me questions while you tour the home.