Estimated Value: $561,000 - $591,000
3
Beds
2
Baths
1,548
Sq Ft
$373/Sq Ft
Est. Value
About This Home
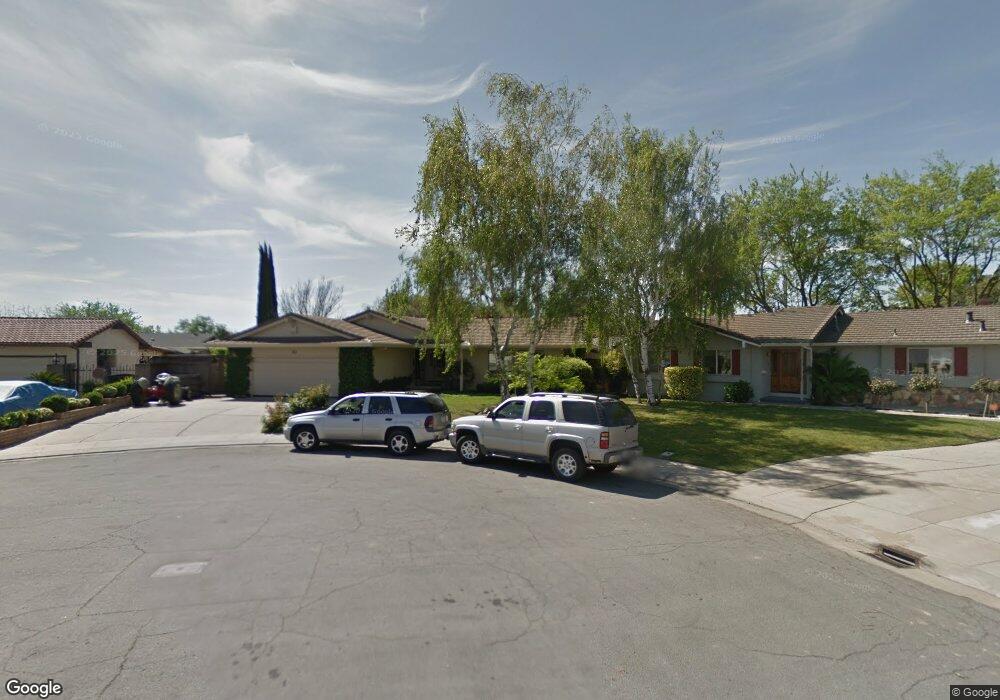
This home is located at 20 Ramona Way, Tracy, CA 95376 and is currently estimated at $578,117, approximately $373 per square foot. 20 Ramona Way is a home located in San Joaquin County with nearby schools including North Elementary School, Merrill F. West High School, and Primary Charter School.
Ownership History
Date
Name
Owned For
Owner Type
Purchase Details
Closed on
Oct 14, 2014
Sold by
Erceg Jacqueline M and Erceg Mike A
Bought by
Erceg Jacqueline M and Erceg Mike A
Current Estimated Value
Purchase Details
Closed on
Jan 29, 2010
Sold by
Erceg Jacqueline M and Erceg Mike A
Bought by
Erceg Mike A and Erceg Jacqueline M
Purchase Details
Closed on
Apr 23, 2009
Sold by
Spencer Gary William and Spencer Sandra Kay
Bought by
Erceg Jacqueline M and Erceg Mike A
Home Financials for this Owner
Home Financials are based on the most recent Mortgage that was taken out on this home.
Original Mortgage
$180,000
Outstanding Balance
$114,277
Interest Rate
5.02%
Mortgage Type
Purchase Money Mortgage
Estimated Equity
$463,840
Purchase Details
Closed on
Jun 14, 2007
Sold by
Spencer Gary William and Spencer Sandra Kay
Bought by
Spencer Gary William and Spencer Sandra Kay
Create a Home Valuation Report for This Property
The Home Valuation Report is an in-depth analysis detailing your home's value as well as a comparison with similar homes in the area
Home Values in the Area
Average Home Value in this Area
Purchase History
| Date | Buyer | Sale Price | Title Company |
|---|---|---|---|
| Erceg Jacqueline M | -- | None Available | |
| Erceg Mike A | -- | None Available | |
| Erceg Jacqueline M | $255,000 | Old Republic Title Company | |
| Spencer Gary William | -- | None Available | |
| Spencer Gary William | -- | None Available |
Source: Public Records
Mortgage History
| Date | Status | Borrower | Loan Amount |
|---|---|---|---|
| Open | Erceg Jacqueline M | $180,000 |
Source: Public Records
Tax History
| Year | Tax Paid | Tax Assessment Tax Assessment Total Assessment is a certain percentage of the fair market value that is determined by local assessors to be the total taxable value of land and additions on the property. | Land | Improvement |
|---|---|---|---|---|
| 2025 | $3,711 | $328,358 | $81,121 | $247,237 |
| 2024 | $3,417 | $321,921 | $79,531 | $242,390 |
| 2023 | $3,363 | $315,610 | $77,972 | $237,638 |
| 2022 | $3,293 | $309,423 | $76,444 | $232,979 |
| 2021 | $3,254 | $303,357 | $74,946 | $228,411 |
| 2020 | $3,232 | $300,247 | $74,178 | $226,069 |
| 2019 | $3,179 | $294,361 | $72,724 | $221,637 |
| 2018 | $3,125 | $288,591 | $71,299 | $217,292 |
| 2017 | $2,967 | $282,933 | $69,901 | $213,032 |
| 2016 | $3,002 | $277,387 | $68,531 | $208,856 |
| 2014 | $2,647 | $253,500 | $76,700 | $176,800 |
Source: Public Records
Map
Nearby Homes
- 2935 Holly Dr
- 2734 Balboa Dr
- 251 Ramona Way
- 252 W Clover Rd Unit A
- 335 W Clover Rd
- 305 Portola Way
- 445 Royal Ct
- 471 Pombo Square Dr
- 3241 Arnaudo Ln
- 613 Carol Louise Ln
- 360 E Grant Line Rd Unit 11
- 360 E Grant Line Rd Unit SPC 18
- 360 E Grant Line Rd Unit 19 A
- 2929 N Macarthur Dr Unit 173
- 379 E 22nd St
- 206 W 20th St
- 1930 Wall St
- 812 W Clover Rd Unit 51
- 1823 Wall St
- 264 W Emerson Ave
Your Personal Tour Guide
Ask me questions while you tour the home.