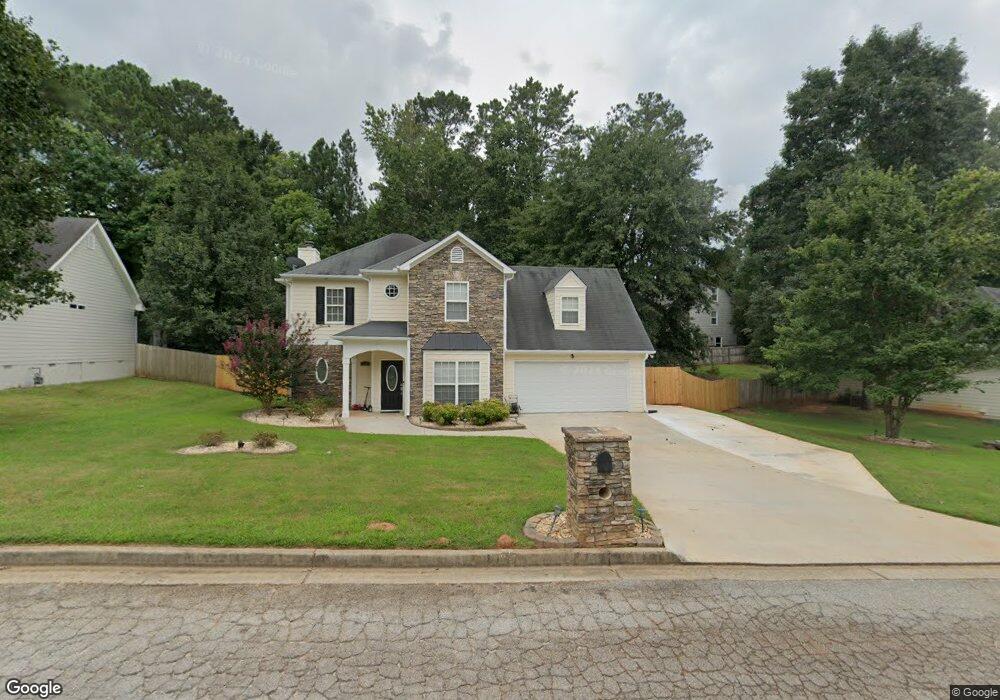
20 Rodney Way Unit 4 Covington, GA 30016
Estimated Value: $292,756 - $322,000
Studio
2
Baths
1,820
Sq Ft
$170/Sq Ft
Est. Value
About This Home
This home is located at 20 Rodney Way Unit 4, Covington, GA 30016 and is currently estimated at $310,189, approximately $170 per square foot. 20 Rodney Way Unit 4 is a home located in Newton County with nearby schools including Porterdale Elementary School, Clements Middle School, and Newton High School.
Ownership History
Date
Name
Owned For
Owner Type
Purchase Details
Closed on
Nov 2, 2020
Sold by
Wallace Marion A
Bought by
Wallace Tanya A
Current Estimated Value
Purchase Details
Closed on
Feb 24, 2003
Sold by
Wallace Tanya A
Bought by
Wallace Tanya A and Wallace Marion A
Home Financials for this Owner
Home Financials are based on the most recent Mortgage that was taken out on this home.
Original Mortgage
$154,900
Interest Rate
5.95%
Mortgage Type
New Conventional
Purchase Details
Closed on
Aug 7, 2001
Sold by
Countrywide Hm Lns Inc
Bought by
Federal National Mortgage Association
Create a Home Valuation Report for This Property
The Home Valuation Report is an in-depth analysis detailing your home's value as well as a comparison with similar homes in the area
Home Values in the Area
Average Home Value in this Area
Purchase History
| Date | Buyer | Sale Price | Title Company |
|---|---|---|---|
| Wallace Tanya A | -- | -- | |
| Wallace Tanya A | -- | -- | |
| Wallace Tanya A | $154,900 | -- | |
| Federal National Mortgage Association | -- | -- | |
| Countrywide Home Loans | $19,000 | -- |
Source: Public Records
Mortgage History
| Date | Status | Borrower | Loan Amount |
|---|---|---|---|
| Previous Owner | Wallace Tanya A | $154,900 |
Source: Public Records
Tax History
| Year | Tax Paid | Tax Assessment Tax Assessment Total Assessment is a certain percentage of the fair market value that is determined by local assessors to be the total taxable value of land and additions on the property. | Land | Improvement |
|---|---|---|---|---|
| 2025 | $2,595 | $107,440 | $20,800 | $86,640 |
| 2024 | $2,607 | $105,440 | $20,800 | $84,640 |
| 2023 | $2,742 | $103,680 | $10,000 | $93,680 |
| 2022 | $2,113 | $80,440 | $10,000 | $70,440 |
| 2021 | $2,088 | $71,560 | $10,000 | $61,560 |
| 2020 | $2,053 | $64,000 | $10,000 | $54,000 |
| 2019 | $1,856 | $57,320 | $10,000 | $47,320 |
| 2018 | $1,804 | $55,440 | $10,000 | $45,440 |
| 2017 | $1,680 | $51,840 | $9,200 | $42,640 |
| 2016 | $1,580 | $48,920 | $4,800 | $44,120 |
| 2015 | $1,494 | $46,480 | $4,800 | $41,680 |
| 2014 | $1,384 | $43,360 | $0 | $0 |
Source: Public Records
Map
Nearby Homes
- 220 Doubles Dr Unit 3
- 65 Westover Place Unit 1
- 120 Dunning Keep Unit 2
- 185 Stephanie Ln
- 150 Stephanie Ln
- 11889 Brown Bridge Rd
- 30 Capeton Ct
- 250 Stonecreek Pkwy
- 430 Fox Meadow Dr
- 510 Stonecreek Ln Unit 56
- 45 Robertford Dr
- 11637 Brown Bridge Rd
- 444 McGiboney Rd Unit 1
- 11565 Brown Bridge Rd
- 290 Trelawney Dr
- 160 Princeton Way
- 40 Oak Terrace Dr
- 450 Fieldstone Ln
- 95 Forray Dr
- 95 Randette Dr
- 30 Rodney Way
- 10 Rodney Way
- 180 Doubles Dr Unit 1
- 25 Rodney Way Unit 4
- 25 Westover Place Unit 1
- 170 Doubles Dr
- 35 Westover Place
- 40 Rodney Way Unit 4
- 210 Doubles Dr
- 45 Westover Place Unit 1
- 25 Stephanie Ln Unit 5
- 55 Rodney Way
- 15 Westover Place
- 50 Rodney Way
- 195 Doubles Dr Unit 65
- 195 Doubles Dr
- 195 Doubles Dr Unit 3
- 185 Doubles Dr
- 185 Doubles Dr Unit 36
- 205 Doubles Dr
Your Personal Tour Guide
Ask me questions while you tour the home.