Estimated Value: $143,669 - $225,000
--
Bed
--
Bath
2,395
Sq Ft
$75/Sq Ft
Est. Value
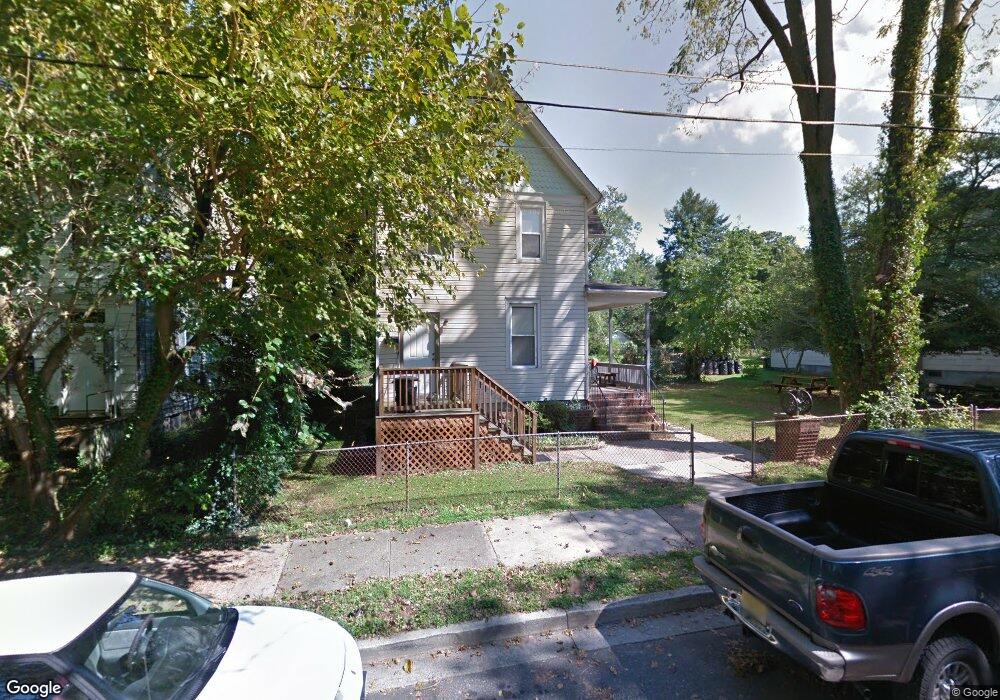
About This Home
This home is located at 20 Seventh St, Salem, NJ 08079 and is currently estimated at $180,667, approximately $75 per square foot. 20 Seventh St is a home located in Salem County with nearby schools including John Fenwick Elementary School, Salem Middle School, and Salem High School.
Ownership History
Date
Name
Owned For
Owner Type
Purchase Details
Closed on
Jun 12, 2024
Sold by
Fuse William G and Fuse Claudia D
Bought by
Vandoren Assets Llc
Current Estimated Value
Home Financials for this Owner
Home Financials are based on the most recent Mortgage that was taken out on this home.
Original Mortgage
$112,000
Outstanding Balance
$110,625
Interest Rate
7.22%
Mortgage Type
New Conventional
Estimated Equity
$70,042
Purchase Details
Closed on
Nov 28, 2000
Create a Home Valuation Report for This Property
The Home Valuation Report is an in-depth analysis detailing your home's value as well as a comparison with similar homes in the area
Home Values in the Area
Average Home Value in this Area
Purchase History
| Date | Buyer | Sale Price | Title Company |
|---|---|---|---|
| Vandoren Assets Llc | $140,000 | None Listed On Document | |
| Vandoren Assets Llc | $140,000 | None Listed On Document | |
| -- | $30,000 | -- |
Source: Public Records
Mortgage History
| Date | Status | Borrower | Loan Amount |
|---|---|---|---|
| Open | Vandoren Assets Llc | $112,000 | |
| Closed | Vandoren Assets Llc | $112,000 |
Source: Public Records
Tax History Compared to Growth
Tax History
| Year | Tax Paid | Tax Assessment Tax Assessment Total Assessment is a certain percentage of the fair market value that is determined by local assessors to be the total taxable value of land and additions on the property. | Land | Improvement |
|---|---|---|---|---|
| 2025 | $4,645 | $56,500 | $10,500 | $46,000 |
| 2024 | $4,441 | $56,500 | $10,500 | $46,000 |
| 2023 | $4,441 | $56,500 | $10,500 | $46,000 |
| 2022 | $4,247 | $56,500 | $10,500 | $46,000 |
| 2021 | $4,101 | $56,500 | $10,500 | $46,000 |
| 2020 | $4,018 | $56,500 | $10,500 | $46,000 |
| 2019 | $3,994 | $56,500 | $10,500 | $46,000 |
| 2018 | $3,906 | $56,500 | $10,500 | $46,000 |
| 2017 | $3,859 | $56,500 | $10,500 | $46,000 |
| 2016 | $2,976 | $76,000 | $15,100 | $60,900 |
| 2015 | $3,947 | $102,100 | $15,100 | $87,000 |
| 2014 | $3,927 | $102,100 | $15,100 | $87,000 |
Source: Public Records
Map
Nearby Homes
- 91 8th St
- 52 Market St
- 146 Seventh St
- 147 Seventh St
- 308 Grant St
- 154 Seventh St
- 162 Seventh St
- 59 Market St
- 175 9th St
- 354 Grant St
- 0 9th St
- 196 198 E Broadway
- 183 E Broadway Unit C-8
- 183 E Broadway Unit C-27
- 33 Johnson St
- 264 E Broadway
- 147 New Union St
- 57 Route 45 Unit 57A
- 272 E Broadway
- 4 Walnut St