Estimated Value: $901,000 - $1,075,000
4
Beds
2
Baths
2,392
Sq Ft
$416/Sq Ft
Est. Value
About This Home
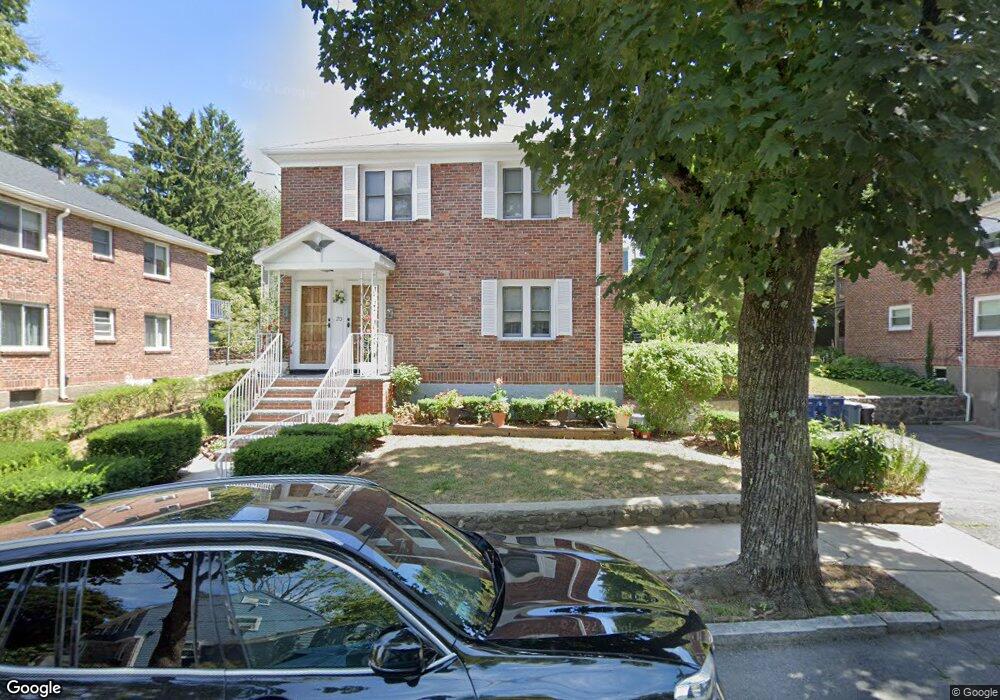
This home is located at 20 Shaw St, West Roxbury, MA 02132 and is currently estimated at $995,170, approximately $416 per square foot. 20 Shaw St is a home located in Suffolk County with nearby schools including St Theresa School, The Roxbury Latin School, and Catholic Memorial School.
Ownership History
Date
Name
Owned For
Owner Type
Purchase Details
Closed on
Apr 23, 2021
Sold by
Kourtis Fotios N Est
Bought by
Fotios N Kourtis 1994 Ret
Current Estimated Value
Purchase Details
Closed on
Mar 18, 2021
Sold by
Fotios N Kourtis 1994 Ret
Bought by
F A Kourtis Ft
Create a Home Valuation Report for This Property
The Home Valuation Report is an in-depth analysis detailing your home's value as well as a comparison with similar homes in the area
Home Values in the Area
Average Home Value in this Area
Purchase History
| Date | Buyer | Sale Price | Title Company |
|---|---|---|---|
| Fotios N Kourtis 1994 Ret | -- | None Available | |
| F A Kourtis Ft | -- | None Available |
Source: Public Records
Tax History Compared to Growth
Tax History
| Year | Tax Paid | Tax Assessment Tax Assessment Total Assessment is a certain percentage of the fair market value that is determined by local assessors to be the total taxable value of land and additions on the property. | Land | Improvement |
|---|---|---|---|---|
| 2025 | $9,507 | $821,000 | $305,200 | $515,800 |
| 2024 | $8,598 | $788,800 | $279,200 | $509,600 |
| 2023 | $7,914 | $736,900 | $260,800 | $476,100 |
| 2022 | $7,565 | $695,300 | $246,100 | $449,200 |
| 2021 | $6,743 | $632,000 | $223,700 | $408,300 |
| 2020 | $6,505 | $616,000 | $202,200 | $413,800 |
| 2019 | $6,125 | $581,100 | $160,200 | $420,900 |
| 2018 | $5,692 | $543,100 | $160,200 | $382,900 |
| 2017 | $5,477 | $517,200 | $160,200 | $357,000 |
| 2016 | $5,369 | $488,100 | $160,200 | $327,900 |
| 2015 | $5,712 | $471,700 | $168,700 | $303,000 |
| 2014 | $5,394 | $428,800 | $168,700 | $260,100 |
Source: Public Records
Map
Nearby Homes
- 145 Lagrange St
- 12 Loyola Cir
- 275 Bellevue St
- 12 Eagle St
- 73 Woodard Rd
- 50 Heron St
- 35 Heron St
- 4873 Washington St Unit 1
- 2 Lagrange St Unit 4
- 14 Starling St
- 10 Starling St
- 348 Lagrange St
- 4959 Washington St
- 54 Sturges Rd
- 4975 Washington St Unit 306
- 4975 Washington St Unit 311
- 152 Stratford St
- 2231 Centre St
- 45 Weymouth Ave
- 12 Bronx Rd
- 24 Shaw St
- 24 Shaw St Unit 1
- 16 Shaw St
- 16 Shaw St Unit 2
- 112 Cowing St
- 112 Cowing St Unit 1
- 112 Cowing St Unit 2
- 108 Cowing St
- 28 Shaw St
- 28 Shaw St Unit 2
- 28 Shaw St Unit 1
- 12 Shaw St
- 21 Shaw St
- 102 Cowing St
- 25 Shaw St
- 32 Shaw St
- 32 Shaw St Unit 2
- 29 Shaw St
- 180 Lagrange St
- 5 Franclaire Dr Unit 5