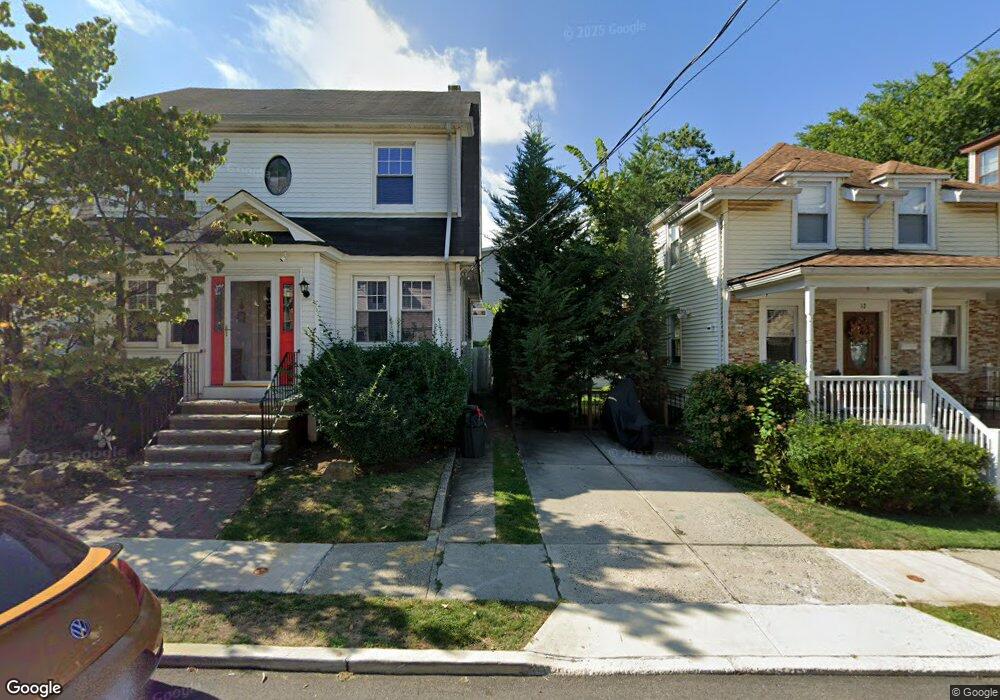
20 Vogel Loop Staten Island, NY 10314
Westerleigh NeighborhoodEstimated Value: $547,000 - $596,000
2
Beds
2
Baths
1,315
Sq Ft
$431/Sq Ft
Est. Value
About This Home
This home is located at 20 Vogel Loop, Staten Island, NY 10314 and is currently estimated at $566,564, approximately $430 per square foot. 20 Vogel Loop is a home located in Richmond County with nearby schools including P.S. 30 Westerleigh, I.S. 51 Edwin Markham, and Port Richmond High School.
Ownership History
Date
Name
Owned For
Owner Type
Purchase Details
Closed on
Jan 15, 2003
Sold by
Difiore Frank and Difiore Julia
Bought by
Heinert Marcia O
Current Estimated Value
Home Financials for this Owner
Home Financials are based on the most recent Mortgage that was taken out on this home.
Original Mortgage
$185,000
Interest Rate
5.9%
Mortgage Type
Purchase Money Mortgage
Purchase Details
Closed on
May 25, 1999
Sold by
Cantirino Gina and Cantirino Richard
Bought by
Difiore Frank and Difiore Julia
Home Financials for this Owner
Home Financials are based on the most recent Mortgage that was taken out on this home.
Original Mortgage
$100,400
Interest Rate
7.19%
Purchase Details
Closed on
Jun 20, 1997
Sold by
Sharrotts Woods Inc
Bought by
Cantirino Richard J and Cintirino Gina M
Create a Home Valuation Report for This Property
The Home Valuation Report is an in-depth analysis detailing your home's value as well as a comparison with similar homes in the area
Home Values in the Area
Average Home Value in this Area
Purchase History
| Date | Buyer | Sale Price | Title Company |
|---|---|---|---|
| Heinert Marcia O | $195,000 | Fidelity National Title Ins | |
| Difiore Frank | $125,500 | Fidelity National Title Ins | |
| Cantirino Richard J | $1,000 | Commonwealth Land Title Ins |
Source: Public Records
Mortgage History
| Date | Status | Borrower | Loan Amount |
|---|---|---|---|
| Previous Owner | Heinert Marcia O | $185,000 | |
| Previous Owner | Difiore Frank | $100,400 |
Source: Public Records
Tax History Compared to Growth
Tax History
| Year | Tax Paid | Tax Assessment Tax Assessment Total Assessment is a certain percentage of the fair market value that is determined by local assessors to be the total taxable value of land and additions on the property. | Land | Improvement |
|---|---|---|---|---|
| 2025 | $4,043 | $33,060 | $6,467 | $26,593 |
| 2024 | $4,043 | $27,120 | $7,438 | $19,682 |
| 2023 | $4,088 | $20,131 | $8,120 | $12,011 |
| 2022 | $3,988 | $21,900 | $10,020 | $11,880 |
| 2021 | $3,967 | $21,960 | $10,020 | $11,940 |
| 2020 | $3,764 | $20,760 | $10,020 | $10,740 |
| 2019 | $3,509 | $21,120 | $10,020 | $11,100 |
| 2018 | $3,420 | $16,776 | $8,338 | $8,438 |
| 2017 | $3,394 | $16,649 | $9,425 | $7,224 |
| 2016 | $3,140 | $15,707 | $9,679 | $6,028 |
| 2015 | $2,683 | $14,818 | $10,708 | $4,110 |
| 2014 | $2,683 | $13,980 | $11,100 | $2,880 |
Source: Public Records
Map
Nearby Homes
- 307 Fiske Ave
- 307 Clinton B Fiske Ave
- 63 Avon Ln
- 14 Leonard Ave
- 282 Willard Ave
- 2111 Victory Blvd
- 142 Margaretta Ct
- 279 Saint John Ave
- 133 Goodwin Ave
- 26 Iowa Place
- 202 Watchogue Rd
- 751 Jewett Ave Unit 17
- 751 Jewett Ave
- 74 Kell Ave
- 125 Westcott Blvd
- 144 Purdy Ave
- 153 Clinton B Fisk Ave
- 25 Coale Ave
- 151 Clinton B Fisk Ave
- 85 Perry Ave