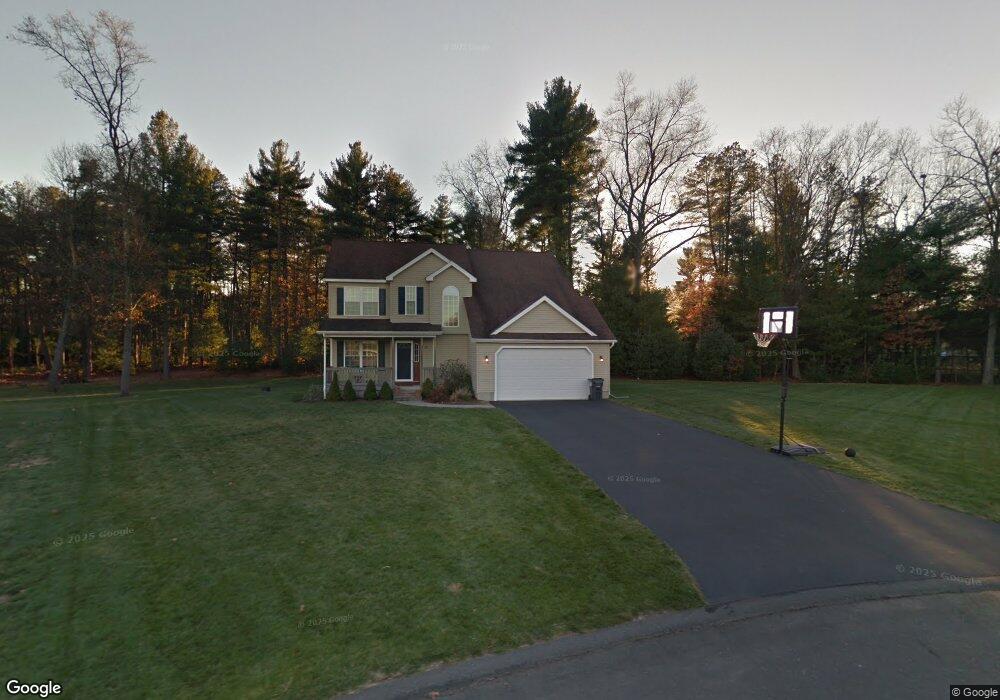
20 Willow Cir Easthampton, MA 01027
Estimated Value: $539,000 - $666,000
4
Beds
3
Baths
2,039
Sq Ft
$302/Sq Ft
Est. Value
About This Home
This home is located at 20 Willow Cir, Easthampton, MA 01027 and is currently estimated at $614,892, approximately $301 per square foot. 20 Willow Cir is a home located in Hampshire County with nearby schools including Easthampton High School, Calvary Baptist Christian School, and Tri-County Schools.
Ownership History
Date
Name
Owned For
Owner Type
Purchase Details
Closed on
Nov 1, 2007
Sold by
Crown Meadow Corp
Bought by
Pasquini-Torchia Jill and Torchia Kevin L
Current Estimated Value
Home Financials for this Owner
Home Financials are based on the most recent Mortgage that was taken out on this home.
Original Mortgage
$292,000
Outstanding Balance
$185,227
Interest Rate
6.43%
Mortgage Type
Purchase Money Mortgage
Estimated Equity
$429,665
Create a Home Valuation Report for This Property
The Home Valuation Report is an in-depth analysis detailing your home's value as well as a comparison with similar homes in the area
Home Values in the Area
Average Home Value in this Area
Purchase History
| Date | Buyer | Sale Price | Title Company |
|---|---|---|---|
| Pasquini-Torchia Jill | $365,000 | -- |
Source: Public Records
Mortgage History
| Date | Status | Borrower | Loan Amount |
|---|---|---|---|
| Open | Pasquini-Torchia Jill | $292,000 |
Source: Public Records
Tax History
| Year | Tax Paid | Tax Assessment Tax Assessment Total Assessment is a certain percentage of the fair market value that is determined by local assessors to be the total taxable value of land and additions on the property. | Land | Improvement |
|---|---|---|---|---|
| 2025 | $7,677 | $561,600 | $132,700 | $428,900 |
| 2024 | $7,446 | $549,100 | $128,800 | $420,300 |
| 2023 | $5,651 | $385,700 | $102,200 | $283,500 |
| 2022 | $6,376 | $385,700 | $102,200 | $283,500 |
| 2021 | $7,032 | $400,900 | $102,200 | $298,700 |
| 2020 | $6,850 | $385,700 | $102,200 | $283,500 |
| 2019 | $6,130 | $396,500 | $119,100 | $277,400 |
| 2018 | $5,893 | $368,300 | $112,100 | $256,200 |
| 2017 | $5,753 | $354,900 | $107,800 | $247,100 |
| 2016 | $5,533 | $354,900 | $107,800 | $247,100 |
| 2015 | $5,377 | $354,900 | $107,800 | $247,100 |
Source: Public Records
Map
Nearby Homes
Your Personal Tour Guide
Ask me questions while you tour the home.