200 Canopy Oak Ln Coolidge, GA 31738
Estimated Value: $211,000 - $311,000
--
Bed
1
Bath
1,609
Sq Ft
$164/Sq Ft
Est. Value
About This Home
This home is located at 200 Canopy Oak Ln, Coolidge, GA 31738 and is currently estimated at $263,576, approximately $163 per square foot. 200 Canopy Oak Ln is a home located in Thomas County with nearby schools including Hand in Hand Primary School, Cross Creek Elementary School, and Garrison-Pilcher Elementary School.
Ownership History
Date
Name
Owned For
Owner Type
Purchase Details
Closed on
Oct 3, 2018
Sold by
Grave De Peralta Jesus I
Bought by
Grave De Peralta Jose M and Grave De Peralta Barbara R
Current Estimated Value
Home Financials for this Owner
Home Financials are based on the most recent Mortgage that was taken out on this home.
Original Mortgage
$110,205
Interest Rate
4.5%
Mortgage Type
New Conventional
Purchase Details
Closed on
Mar 22, 2010
Sold by
Foy Darin L and Foy Wendy A
Bought by
Grave De Peralta Jesus I
Home Financials for this Owner
Home Financials are based on the most recent Mortgage that was taken out on this home.
Original Mortgage
$142,200
Interest Rate
4.91%
Mortgage Type
Future Advance Clause Open End Mortgage
Purchase Details
Closed on
Sep 29, 2000
Sold by
Dea-Canes Associates Llc
Bought by
Foy Darin L and Foy Wendy A
Purchase Details
Closed on
May 4, 2000
Sold by
Hanna Marshall S
Bought by
Dea-Canes Associates Llc
Purchase Details
Closed on
Aug 15, 1995
Bought by
Hanna Marshall S
Create a Home Valuation Report for This Property
The Home Valuation Report is an in-depth analysis detailing your home's value as well as a comparison with similar homes in the area
Home Values in the Area
Average Home Value in this Area
Purchase History
| Date | Buyer | Sale Price | Title Company |
|---|---|---|---|
| Grave De Peralta Jose M | $110,205 | -- | |
| Grave De Peralta Jesus I | $158,000 | -- | |
| Foy Darin L | $31,300 | -- | |
| Dea-Canes Associates Llc | $84,000 | -- | |
| Hanna Marshall S | $34,000 | -- |
Source: Public Records
Mortgage History
| Date | Status | Borrower | Loan Amount |
|---|---|---|---|
| Closed | Grave De Peralta Jose M | $110,205 | |
| Previous Owner | Grave De Peralta Jesus I | $142,200 |
Source: Public Records
Tax History Compared to Growth
Tax History
| Year | Tax Paid | Tax Assessment Tax Assessment Total Assessment is a certain percentage of the fair market value that is determined by local assessors to be the total taxable value of land and additions on the property. | Land | Improvement |
|---|---|---|---|---|
| 2024 | $2,119 | $102,713 | $25,408 | $77,305 |
| 2023 | $1,837 | $91,206 | $20,326 | $70,880 |
| 2022 | $1,828 | $82,179 | $20,326 | $61,853 |
| 2021 | $1,718 | $70,157 | $17,674 | $52,483 |
| 2020 | $1,685 | $67,091 | $17,675 | $49,416 |
| 2019 | $1,703 | $67,091 | $17,675 | $49,416 |
| 2018 | $1,722 | $66,481 | $17,675 | $48,806 |
| 2017 | $1,829 | $65,981 | $17,675 | $48,306 |
| 2016 | $1,668 | $64,631 | $17,675 | $46,956 |
| 2015 | $1,299 | $49,931 | $17,675 | $32,256 |
| 2014 | $1,287 | $49,292 | $17,675 | $31,617 |
| 2013 | -- | $49,292 | $17,674 | $31,617 |
Source: Public Records
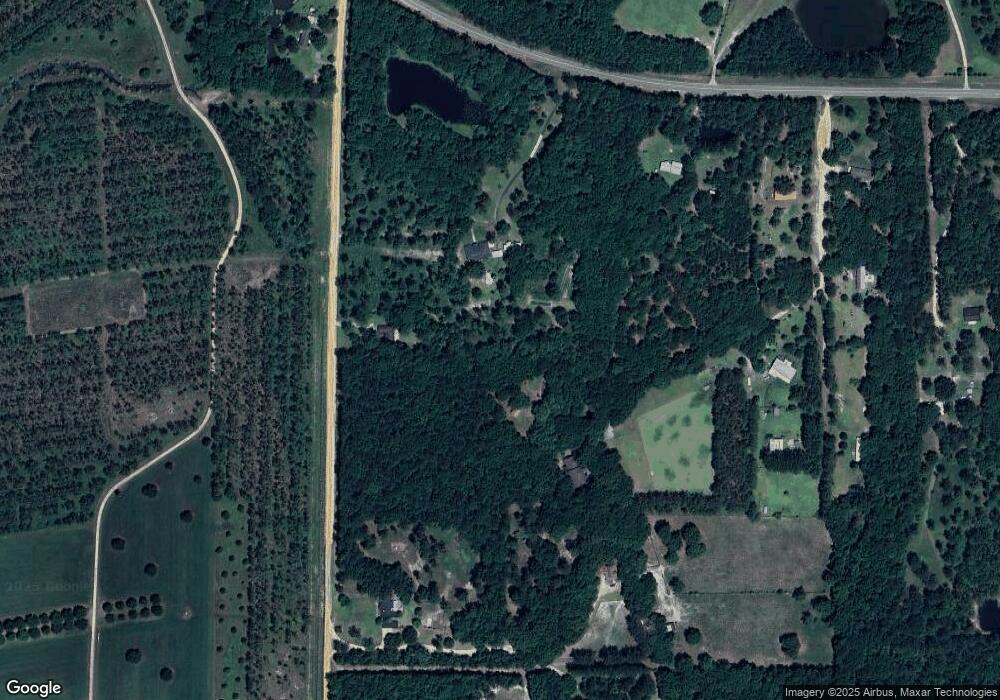
Map
Nearby Homes
- 21688 US Highway 319 N
- 21688 U S 319
- 2069 Baker Rd
- 4016 E Japonica Ave
- 0000 N
- 112 Morgan Place
- 110 Morgan Place
- 100 Morgan Place
- 102 Morgan Place
- 258
- 10806 Georgia 202
- 785 Glynn Willis Rd
- 1291 Myron Hart Rd
- 475 Longwood Dr
- 900 Benton Rd
- 3007 Zion Grove Church Rd
- 00 Drury Ln
- 8805 Georgia 202
- 171 Longwood Dr
- 250 Knoll Rd
- 270 Canopy Oak Ln
- 13746 Ga Highway 188
- 1584 Carlton Rd
- 1250 Carlton Rd
- 1262 Carlton Rd
- 14272 State Route 188
- 14272 Ga Highway 188
- 13948 Ga Highway 188
- 14264 State Route 188
- 1240 Carlton Rd
- 14300 Ga Highway 188
- 1875 Carlton Rd
- 14326 Ga Highway 188
- 14418 Ga Highway 188
- 950 Carlton Rd
- 14173 Ga Highway 188
- 13504 State Route 188
- 14173 State Route 188
- 14476 State Route 188
- 14418 State Route 188