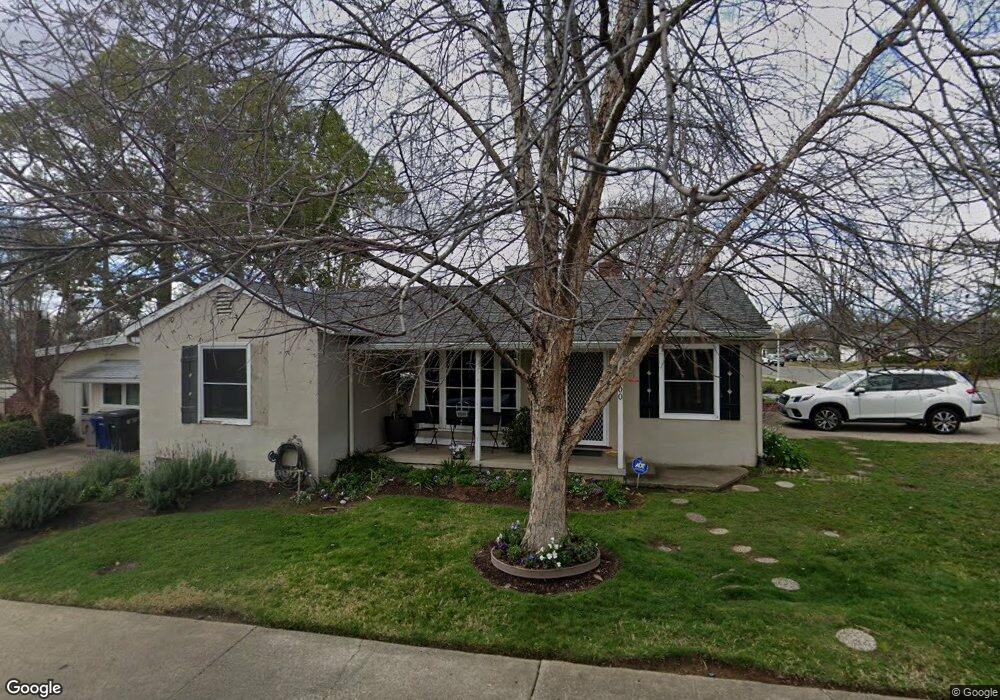
200 Coloma Way Sacramento, CA 95819
East Sacramento NeighborhoodEstimated Value: $551,000
3
Beds
2
Baths
1,900
Sq Ft
$290/Sq Ft
Est. Value
About This Home
This home is located at 200 Coloma Way, Sacramento, CA 95819 and is currently estimated at $551,000, approximately $290 per square foot. 200 Coloma Way is a home located in Sacramento County with nearby schools including Theodore Judah Elementary, Miwok Middle School, and Hiram W. Johnson High School.
Ownership History
Date
Name
Owned For
Owner Type
Purchase Details
Closed on
Aug 5, 2017
Sold by
Saltenberger Pamela
Bought by
Saltenberger Pamela and Pamela Saltenberger Revocable
Current Estimated Value
Purchase Details
Closed on
Oct 22, 2015
Sold by
Saltenberger Pamela and Pamela Saltenberger Revocable
Bought by
Saltenberger Pamela and Pamela Saltenberger Revocable
Purchase Details
Closed on
Dec 15, 2003
Sold by
Saltenberger Pamela G
Bought by
Saltenberger Pamela and Pamela Saltenberger Revocable
Purchase Details
Closed on
Dec 12, 2003
Sold by
Saltenberger Otto H
Bought by
Saltenberger Pamela G
Create a Home Valuation Report for This Property
The Home Valuation Report is an in-depth analysis detailing your home's value as well as a comparison with similar homes in the area
Home Values in the Area
Average Home Value in this Area
Purchase History
| Date | Buyer | Sale Price | Title Company |
|---|---|---|---|
| Saltenberger Pamela | -- | None Available | |
| Saltenberger Pamela | -- | None Available | |
| Saltenberger Pamela | -- | -- | |
| Saltenberger Pamela G | -- | -- |
Source: Public Records
Tax History Compared to Growth
Tax History
| Year | Tax Paid | Tax Assessment Tax Assessment Total Assessment is a certain percentage of the fair market value that is determined by local assessors to be the total taxable value of land and additions on the property. | Land | Improvement |
|---|---|---|---|---|
| 2025 | $2,540 | $194,251 | $27,723 | $166,528 |
| 2024 | $2,540 | $190,443 | $27,180 | $163,263 |
| 2023 | $2,479 | $186,710 | $26,648 | $160,062 |
| 2022 | $2,436 | $183,050 | $26,126 | $156,924 |
| 2021 | $2,325 | $179,462 | $25,614 | $153,848 |
| 2020 | $2,337 | $177,623 | $25,352 | $152,271 |
| 2019 | $2,290 | $174,141 | $24,855 | $149,286 |
| 2018 | $2,231 | $170,727 | $24,368 | $146,359 |
| 2017 | $2,197 | $167,381 | $23,891 | $143,490 |
| 2016 | $2,147 | $164,100 | $23,423 | $140,677 |
| 2015 | $2,114 | $161,636 | $23,072 | $138,564 |
| 2014 | $2,063 | $158,471 | $22,621 | $135,850 |
Source: Public Records
Map
Nearby Homes