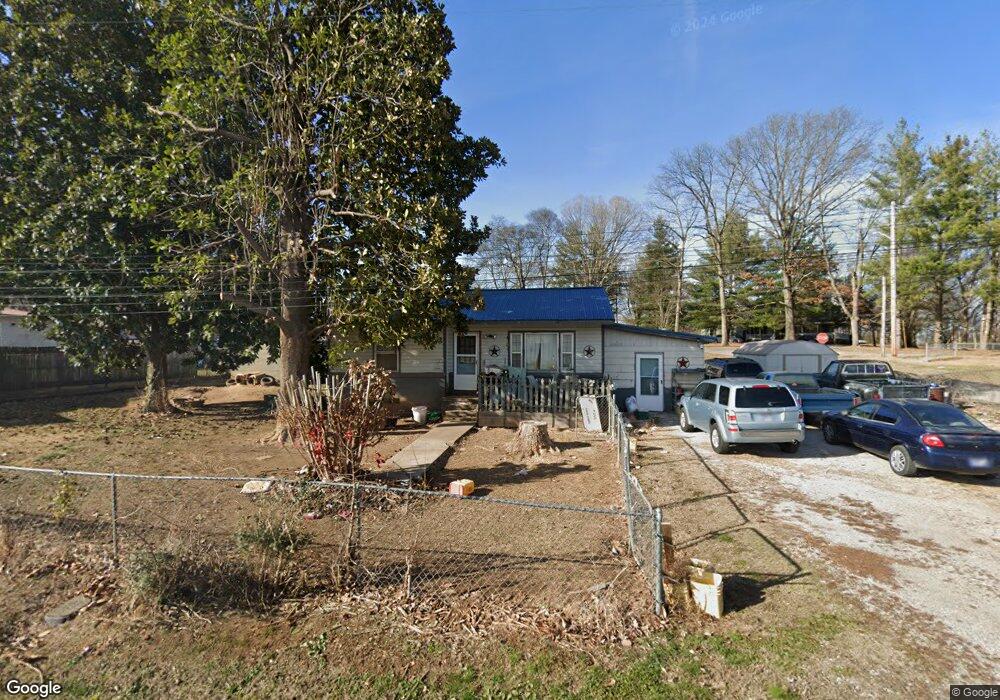
200 Cumberland St Decherd, TN 37324
Estimated Value: $124,692 - $191,000
Studio
1
Bath
1,036
Sq Ft
$156/Sq Ft
Est. Value
About This Home
This home is located at 200 Cumberland St, Decherd, TN 37324 and is currently estimated at $161,231, approximately $155 per square foot. 200 Cumberland St is a home located in Franklin County with nearby schools including North Middle School, South Middle School, and Franklin County High School.
Ownership History
Date
Name
Owned For
Owner Type
Purchase Details
Closed on
Feb 24, 2003
Sold by
Federal Home Loan Mortgage Corporation
Bought by
Nunley Jennifer D
Current Estimated Value
Purchase Details
Closed on
Dec 23, 2002
Sold by
Nash Mark A
Bought by
Federal Home Loan Mortgage Corporation
Purchase Details
Closed on
Nov 15, 2002
Bought by
Federal Hm Ln Mort Corp % Countrywide Hm Loan
Purchase Details
Closed on
Sep 2, 1998
Sold by
Caldwell Troy D
Bought by
Nash Mark A
Purchase Details
Closed on
Jul 3, 1991
Bought by
Caldwell Troy D
Purchase Details
Closed on
Jan 29, 1991
Bought by
Veterans Administration
Purchase Details
Closed on
Jan 22, 1991
Bought by
Chemical Mort Co
Purchase Details
Closed on
Nov 16, 1988
Bought by
Deem Bryan Richard
Purchase Details
Closed on
Jan 28, 1974
Bought by
Dyer Raymond and Dyer Lucy
Create a Home Valuation Report for This Property
The Home Valuation Report is an in-depth analysis detailing your home's value as well as a comparison with similar homes in the area
Purchase History
| Date | Buyer | Sale Price | Title Company |
|---|---|---|---|
| Nunley Jennifer D | $32,000 | -- | |
| Federal Home Loan Mortgage Corporation | -- | -- | |
| Federal Hm Ln Mort Corp % Countrywide Hm Loan | $38,300 | -- | |
| Nash Mark A | $41,000 | -- | |
| Caldwell Troy D | $25,100 | -- | |
| Veterans Administration | -- | -- | |
| Chemical Mort Co | -- | -- | |
| Deem Bryan Richard | -- | -- | |
| Dyer Raymond | -- | -- |
Source: Public Records
Tax History
| Year | Tax Paid | Tax Assessment Tax Assessment Total Assessment is a certain percentage of the fair market value that is determined by local assessors to be the total taxable value of land and additions on the property. | Land | Improvement |
|---|---|---|---|---|
| 2025 | -- | $20,825 | $2,250 | $18,575 |
| 2024 | -- | $20,825 | $2,250 | $18,575 |
| 2023 | $570 | $20,700 | $2,250 | $18,450 |
| 2022 | $539 | $20,700 | $2,250 | $18,450 |
| 2021 | $331 | $20,700 | $2,250 | $18,450 |
| 2020 | $473 | $11,800 | $1,675 | $10,125 |
| 2019 | $473 | $11,800 | $1,675 | $10,125 |
| 2018 | $449 | $11,800 | $1,675 | $10,125 |
| 2017 | $449 | $11,800 | $1,675 | $10,125 |
| 2016 | $439 | $11,525 | $1,675 | $9,850 |
| 2015 | $439 | $11,525 | $1,675 | $9,850 |
| 2014 | $438 | $11,515 | $0 | $0 |
Source: Public Records
Map
Nearby Homes
- 909 Cumberland St Unit 911
- 203 5th Ave N
- 1105 Cumberland St Unit 1107
- 501 W Broad St
- 404 Horton St
- 44 Flint Dr
- 202 W Main St
- 106 5th Ave N
- 201 10th Ave N
- 107 N West St
- 206 Hotel St
- 207 Powell St
- 0 N Bratton St
- 240 Dogwood Dr
- 208 Tammy Dr
- 205 Mary Sharp Dr
- 0 Aedc Rd Unit RTC3073348
- 105 Lakeview Dr
- 401 E Petty Ln
- 210 E Petty Ln
Your Personal Tour Guide
Ask me questions while you tour the home.