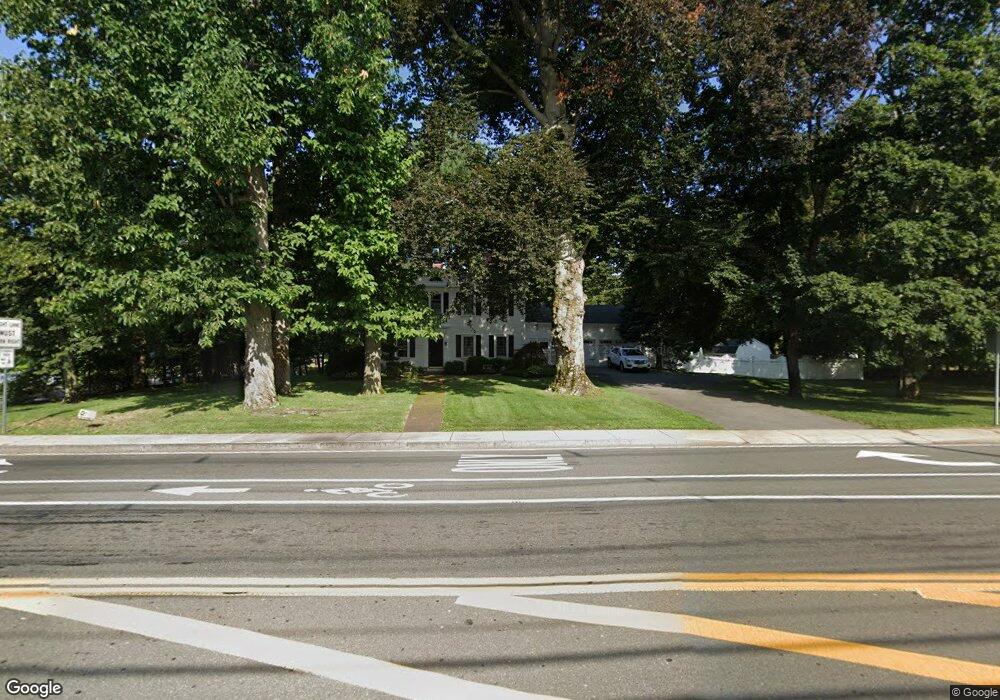
200 Middlesex Ave Wilmington, MA 01887
North Wilmington NeighborhoodEstimated Value: $1,030,000 - $1,314,000
3
Beds
3
Baths
3,400
Sq Ft
$327/Sq Ft
Est. Value
About This Home
This home is located at 200 Middlesex Ave, Wilmington, MA 01887 and is currently estimated at $1,112,181, approximately $327 per square foot. 200 Middlesex Ave is a home located in Middlesex County with nearby schools including Wilmington Middle School, Wilmington High School, and Abundant Life Christian School and Childcare.
Ownership History
Date
Name
Owned For
Owner Type
Purchase Details
Closed on
Jul 29, 2005
Sold by
Esposito Jane S and Esposito Kerry A
Bought by
Valenca Alan and Valenca Liza
Current Estimated Value
Create a Home Valuation Report for This Property
The Home Valuation Report is an in-depth analysis detailing your home's value as well as a comparison with similar homes in the area
Home Values in the Area
Average Home Value in this Area
Purchase History
| Date | Buyer | Sale Price | Title Company |
|---|---|---|---|
| Valenca Alan | $620,000 | -- |
Source: Public Records
Tax History Compared to Growth
Tax History
| Year | Tax Paid | Tax Assessment Tax Assessment Total Assessment is a certain percentage of the fair market value that is determined by local assessors to be the total taxable value of land and additions on the property. | Land | Improvement |
|---|---|---|---|---|
| 2025 | $10,568 | $923,000 | $288,500 | $634,500 |
| 2024 | $9,815 | $858,700 | $288,500 | $570,200 |
| 2023 | $9,634 | $806,900 | $262,200 | $544,700 |
| 2022 | $9,630 | $739,100 | $218,500 | $520,600 |
| 2021 | $10,179 | $735,500 | $198,600 | $536,900 |
| 2020 | $10,400 | $765,800 | $198,600 | $567,200 |
| 2019 | $10,002 | $727,400 | $189,200 | $538,200 |
| 2018 | $10,136 | $703,400 | $180,100 | $523,300 |
| 2017 | $10,164 | $703,400 | $180,100 | $523,300 |
| 2016 | $9,441 | $645,300 | $171,600 | $473,700 |
| 2015 | $8,753 | $609,100 | $171,600 | $437,500 |
| 2014 | $8,246 | $579,100 | $163,300 | $415,800 |
Source: Public Records
Map
Nearby Homes
- 96 Middlesex Ave
- 3 Oakdale Rd
- 5 Flynn Way
- 27 Fairview Ave
- 414-418 Main St
- 9 Parker St
- 17 Molloy Rd
- 7 Cross St Unit 306
- 7 Cross St Unit 304
- 7 Cross St Unit 205
- 48 Brand Ave
- 40 Faulkner Ave
- 61 Lowell St
- 1 March Rd
- 62 Faulkner Ave
- 7 Cross St (Units 201 & 202)
- 56 Grove Ave
- 17 Lake St
- 11 Patchs Pond Ln
- 3 Adelman Rd