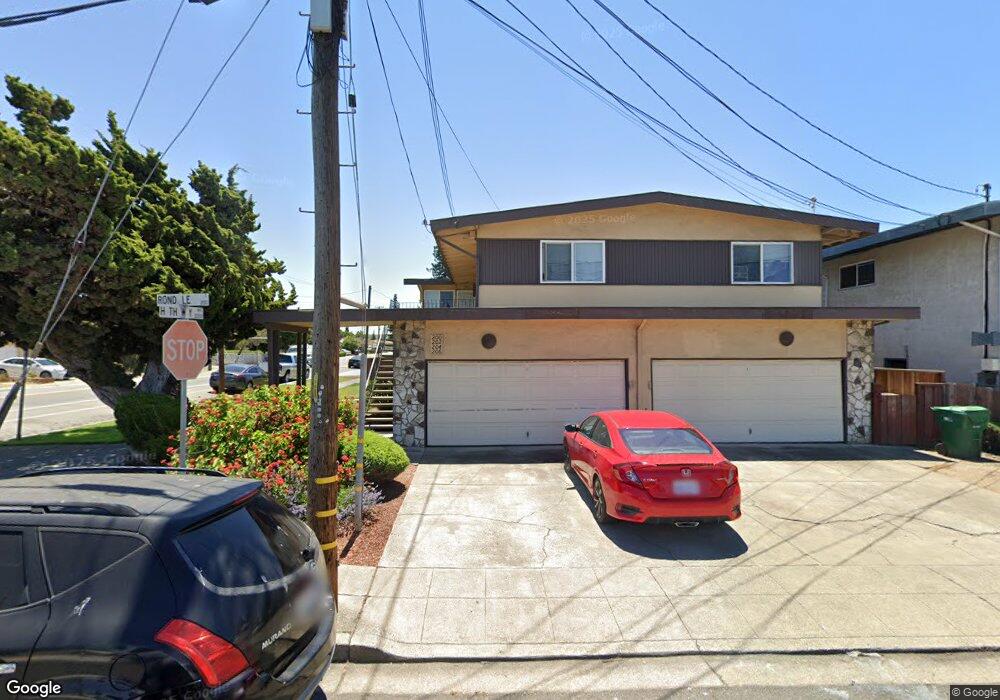
200 Rondale Ct Hayward, CA 94541
Estimated Value: $1,227,000 - $1,418,000
8
Beds
4
Baths
3,966
Sq Ft
$337/Sq Ft
Est. Value
About This Home
This home is located at 200 Rondale Ct, Hayward, CA 94541 and is currently estimated at $1,337,667, approximately $337 per square foot. 200 Rondale Ct is a home located in Alameda County with nearby schools including Lorenzo Manor Elementary School, Bohannon Middle School, and San Lorenzo High School.
Ownership History
Date
Name
Owned For
Owner Type
Purchase Details
Closed on
Aug 31, 2010
Sold by
Mcmanus Karen Ann Bliss and Bledsoe Kay M
Bought by
Mcmanus Karen Bliss and Karen Bliss Mcmanus Revocable
Current Estimated Value
Purchase Details
Closed on
Aug 30, 2010
Sold by
Bledsoe Kay M and Bledsoe Kenneth W
Bought by
Mcmanus Karen Bliss and Karen Bliss Mcmanus Revocable
Purchase Details
Closed on
May 24, 2007
Sold by
Kriewaldt Mary Ann and Mcmanus Karen Ann Bliss
Bought by
Kriewaldt Mary Ann and Mcmanus Karen Ann Bliss
Purchase Details
Closed on
Jan 10, 2002
Sold by
Kriewaldt Elmer E and Kriewaldt Mary Ann
Bought by
Bledsoe Kenneth W and Bledsoe Kay M
Purchase Details
Closed on
Dec 27, 2001
Sold by
Kriewaldt Elmer E and Kriewaldt Mary Ann
Bought by
Bledsoe Kenneth W and Bledsoe Kay M
Purchase Details
Closed on
Jan 10, 2000
Sold by
Kriewaldt Elmer and Kriewaldt Mary A
Bought by
Bledsoe Kenneth W and Bledsoe Kay M
Purchase Details
Closed on
Dec 21, 1999
Sold by
Kriewaldt Elmer and Kriewaldt Mary A
Bought by
Bledsoe Kenneth W and Bledsoe Kay M
Create a Home Valuation Report for This Property
The Home Valuation Report is an in-depth analysis detailing your home's value as well as a comparison with similar homes in the area
Home Values in the Area
Average Home Value in this Area
Purchase History
| Date | Buyer | Sale Price | Title Company |
|---|---|---|---|
| Mcmanus Karen Bliss | -- | None Available | |
| Mcmanus Karen Bliss | $223,500 | None Available | |
| Kriewaldt Mary Ann | -- | None Available | |
| Kriewaldt Mary Ann | -- | None Available | |
| Bledsoe Kenneth W | -- | -- | |
| Bledsoe Kenneth W | -- | -- | |
| Bledsoe Kenneth W | -- | -- | |
| Bledsoe Kenneth W | -- | -- |
Source: Public Records
Tax History
| Year | Tax Paid | Tax Assessment Tax Assessment Total Assessment is a certain percentage of the fair market value that is determined by local assessors to be the total taxable value of land and additions on the property. | Land | Improvement |
|---|---|---|---|---|
| 2025 | $7,182 | $409,976 | $128,530 | $281,446 |
| 2024 | $7,182 | $401,941 | $126,011 | $275,930 |
| 2023 | $7,226 | $394,061 | $123,540 | $270,521 |
| 2022 | $7,034 | $386,335 | $121,118 | $265,217 |
| 2021 | $6,783 | $378,761 | $118,744 | $260,017 |
| 2020 | $6,561 | $374,879 | $117,527 | $257,352 |
| 2019 | $6,496 | $367,531 | $115,223 | $252,308 |
| 2018 | $6,132 | $360,327 | $112,964 | $247,363 |
| 2017 | $5,855 | $353,264 | $110,750 | $242,514 |
| 2016 | $5,584 | $346,339 | $108,579 | $237,760 |
| 2015 | $5,442 | $341,137 | $106,948 | $234,189 |
| 2014 | $5,343 | $334,456 | $104,854 | $229,602 |
Source: Public Records
Map
Nearby Homes
- 21335 Hathaway Ave
- 19378 Ricardo Ave
- 412 Solano Ave
- 19884 Meekland Ave
- 10 Leighty Ct Unit 5
- 21564 Meekland Ave Unit 2
- 21371 Garden Ave
- 21806 Meekland Ave
- 730 W Sunset Blvd
- 20667 Blossom Common
- 263 Medford Ave
- 20923 Haviland Ave
- 18407 Rainier Ave
- 19150 Hesperian Blvd Unit 19
- 17779 Rainier Ave
- 595 Blossom Way Unit 10
- 17790 Via Arriba
- 19671 Medford Cir Unit 22
- 257 Poplar Ave
- 127 Hampton Rd
- 210 Rondale Ct
- 20553 Hathaway Ave
- 226 Rondale Ct
- 20450 Hathaway Ave
- 201 Rondale Ct
- 20552 Hathaway Ave
- 20266 Hathaway Ave
- 230 Rondale Ct
- 211 Rondale Ct
- 160 Lucot St
- 20655 Hathaway Ave
- 20749 Hathaway Ave
- 161 Lucot St
- 159 Florence St
- 140 Lucot St
- 20833 Hathaway Ave
- 20164 Hathaway Ave
- 20139 Hathaway Ave
- 20748 Hathaway Ave
- 210 Bunny Ct
Your Personal Tour Guide
Ask me questions while you tour the home.