
Estimated payment $1,222/month
4
Beds
2
Baths
3,006
Sq Ft
$66
Price per Sq Ft
Highlights
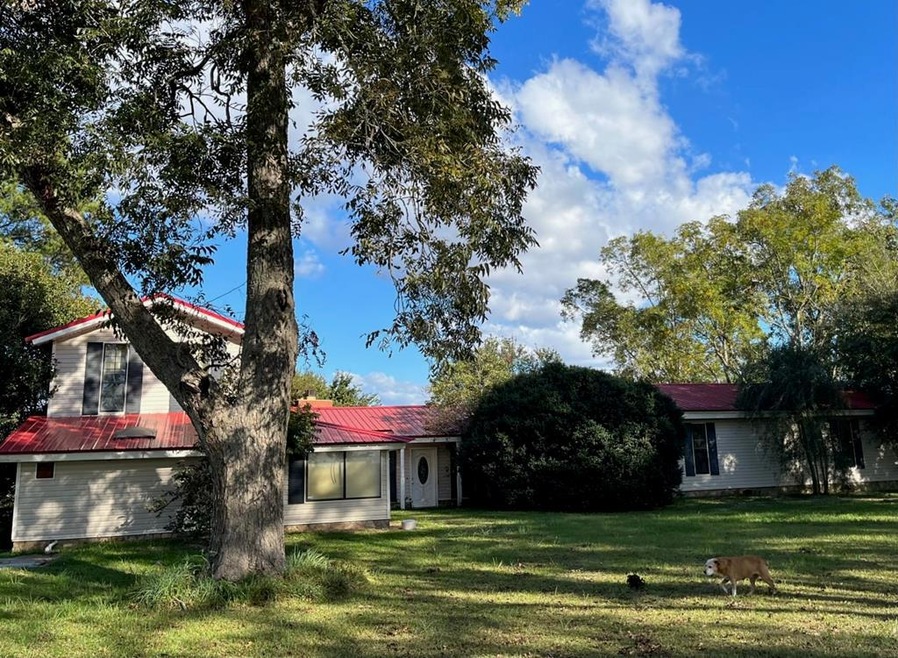
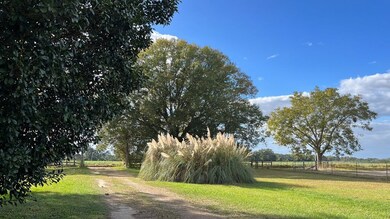
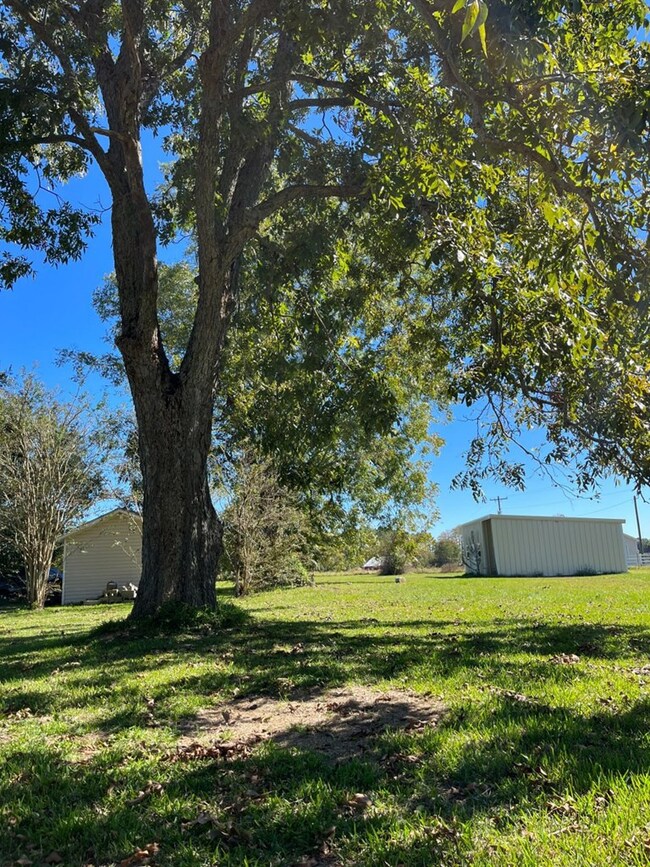
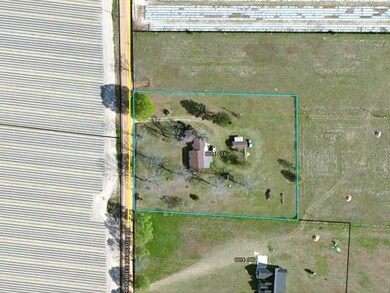
- 2.74 Acre Lot
- Central Heating and Cooling System
- 1-Story Property
- No HOA
- Fenced
About This Home
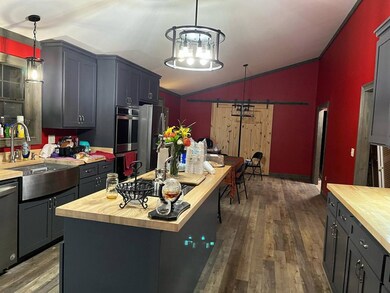
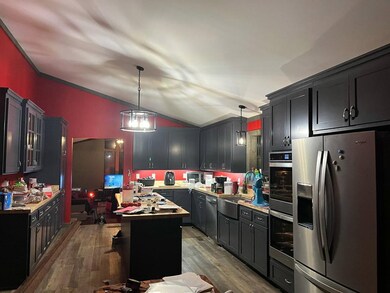
Handyman special! This home is perfect if you're the type to want to remodel and make your house your own. Seller has a lot of the materials to finish the remodel, juts can't finish it. The kitchen is beautiful! Featuring a double, wifi enabled oven, newer appliances, LVP flooring and much more. All on almost 3 acres in the country.
Listing Agent
Jim Long Real Estate Brokerage Phone: 2298965002 License #425530 Listed on: 06/29/2025
Home Details
Home Type
- Single Family
Est. Annual Taxes
- $1,455
Lot Details
- 2.74 Acre Lot
- Lot Dimensions are 402 x 304 x 402 x 286
- Fenced
- Property is zoned R3
Parking
- 3 Parking Spaces
Home Design
- Metal Roof
Interior Spaces
- 3,006 Sq Ft Home
- 1-Story Property
Kitchen
- Built-In Oven
- Electric Range
- Dishwasher
Bedrooms and Bathrooms
- 4 Bedrooms
- 2 Full Bathrooms
Utilities
- Central Heating and Cooling System
- Well
- Septic Tank
Community Details
- No Home Owners Association
- Rural Subdivision
Listing and Financial Details
- Assessor Parcel Number 0014 033
Map
Create a Home Valuation Report for This Property
The Home Valuation Report is an in-depth analysis detailing your home's value as well as a comparison with similar homes in the area
Home Values in the Area
Average Home Value in this Area
Tax History
| Year | Tax Paid | Tax Assessment Tax Assessment Total Assessment is a certain percentage of the fair market value that is determined by local assessors to be the total taxable value of land and additions on the property. | Land | Improvement |
|---|---|---|---|---|
| 2024 | $1,811 | $67,214 | $8,424 | $58,790 |
| 2023 | $1,603 | $59,523 | $8,424 | $51,099 |
| 2022 | $1,579 | $58,621 | $7,522 | $51,099 |
| 2021 | $1,443 | $49,987 | $7,522 | $42,465 |
| 2020 | $1,375 | $49,987 | $7,522 | $42,465 |
| 2019 | $1,444 | $49,987 | $7,522 | $42,465 |
| 2018 | $1,445 | $49,987 | $7,522 | $42,465 |
| 2017 | $1,446 | $49,987 | $7,522 | $42,465 |
| 2016 | $1,448 | $49,987 | $7,522 | $42,465 |
| 2015 | $1,450 | $49,987 | $7,522 | $42,465 |
| 2014 | $1,453 | $49,987 | $7,522 | $42,465 |
| 2013 | -- | $58,343 | $8,357 | $49,986 |
Source: Public Records
Property History
| Date | Event | Price | Change | Sq Ft Price |
|---|---|---|---|---|
| 06/29/2025 06/29/25 | Pending | -- | -- | -- |
| 06/29/2025 06/29/25 | For Sale | $198,500 | -- | $66 / Sq Ft |
Source: South Georgia MLS
Purchase History
| Date | Type | Sale Price | Title Company |
|---|---|---|---|
| Warranty Deed | $119,021 | -- | |
| Warranty Deed | $120,000 | -- | |
| Deed | -- | -- | |
| Warranty Deed | -- | -- | |
| Warranty Deed | $150,000 | -- |
Source: Public Records
Mortgage History
| Date | Status | Loan Amount | Loan Type |
|---|---|---|---|
| Previous Owner | $123,469 | New Conventional | |
| Previous Owner | $71,200 | New Conventional | |
| Previous Owner | $68,500 | New Conventional | |
| Previous Owner | $30,000 | New Conventional |
Source: Public Records
Similar Homes in Adel, GA
-
$229,900
- 2 Beds
- 2 Baths
- 1,623 Sq Ft
- 1101 Breckenridge Dr
- Adel, GA
This is the property you've been waiting for! Sitting on a half acre corner lot, this beautiful 2 bed/2 bath brick home is located in a sought after neighborhood. New kitchen includes all appliances, oversized island and plenty of storage. Open to the kitchen you'll find the formal dining room and large living room providing tons of entertainment space. This home has LVP and tiled floors all
Joey Schramm Southern Classic Realtors
-
$239,900
- 3 Beds
- 3 Baths
- 2,162 Sq Ft
- 418 E 3rd St
- Adel, GA
Take a look at this 2100 sqft home sitting in a quiet neighborhood, just blocks from the heart of Adel! This spacious 3 bed 3 bath home has beautiful tile and lvp flooring throughout as well as walk-in showers, soaking tubs, walk-in closets, plus more. Out back you'll find a screened in back porch overlooking the above ground swimming pool and large back yard, perfect for enjoying evenings with
Joey Schramm Southern Classic Realtors
-
$210,000
- 3 Beds
- 2 Baths
- 1,716 Sq Ft
- 806 S Forrest Ave
- Adel, GA
PRICE IMPROVEMENT! This beautiful 3 bedroom, 2 bath brick home has so much to offer! Located near downtown Adel and I75, this property features a 2 car garage, privacy fenced backyard with a patio for entertaining, and a spacious living area with a fireplace. The kitchen includes a breakfast bar and a window over the sink for outside viewing. This is a MUST SEE property. Call today to set up
Justin Liles Lock and Key Realty
Source: South Georgia MLS
MLS Number: 145420
APN: 0014-033
Nearby Homes
- 130 Rountree McCranie Rd
- 515 John Keigans Memorial
- 2231 Nell Purvis Rd
- 1578 McConnell Bridge Rd
- 123 Westover Dr
- 289 Arthur Newbern Rd
- 310 Cleveland St
- 104 Janet St
- 703 N Elm St
- 905 W 5th St
- 604 Bethany St
- 0 Sparks Mobile Home Park Unit 10452754
- 37 Sparks Mobile Home Park Unit 37
- 25 Stephen Williams Ln
- 25 Stevens Williams Ln
- 609 W 4th St
- 609 W 6th St
- 314 N Maple St
- 814 N Cleveland Ave
- * Wayne - Seventh Unit 2