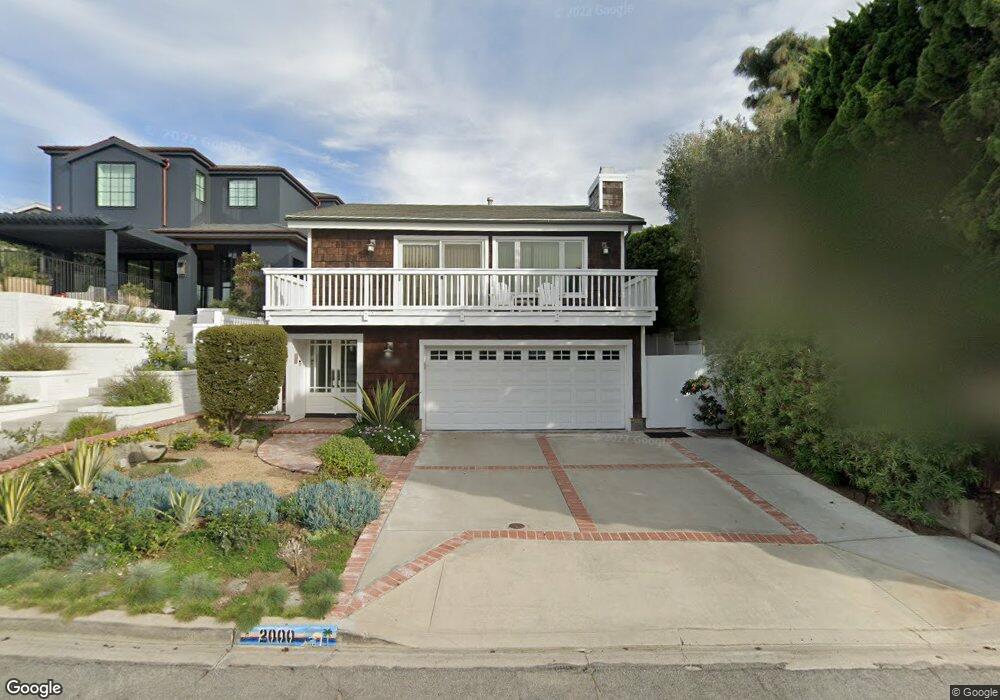
2000 Agnes Rd Manhattan Beach, CA 90266
Estimated Value: $3,257,000 - $4,231,000
4
Beds
3
Baths
2,870
Sq Ft
$1,283/Sq Ft
Est. Value
About This Home
This home is located at 2000 Agnes Rd, Manhattan Beach, CA 90266 and is currently estimated at $3,682,484, approximately $1,283 per square foot. 2000 Agnes Rd is a home located in Los Angeles County with nearby schools including Pacific Elementary School, Manhattan Beach Middle School, and Mira Costa High School.
Ownership History
Date
Name
Owned For
Owner Type
Purchase Details
Closed on
Mar 15, 2005
Sold by
Flanagan Joseph Leo and Flanagan Linda Sweeney
Bought by
Flanagan Joseph L
Current Estimated Value
Purchase Details
Closed on
Jan 31, 2002
Sold by
Finnerty Patrick T and Finnerty Patricia D
Bought by
Flanagan Joseph Leo
Home Financials for this Owner
Home Financials are based on the most recent Mortgage that was taken out on this home.
Original Mortgage
$650,000
Outstanding Balance
$250,847
Interest Rate
6.12%
Estimated Equity
$3,431,637
Create a Home Valuation Report for This Property
The Home Valuation Report is an in-depth analysis detailing your home's value as well as a comparison with similar homes in the area
Home Values in the Area
Average Home Value in this Area
Purchase History
| Date | Buyer | Sale Price | Title Company |
|---|---|---|---|
| Flanagan Joseph L | -- | -- | |
| Flanagan Joseph Leo | $900,000 | Gateway Title Company |
Source: Public Records
Mortgage History
| Date | Status | Borrower | Loan Amount |
|---|---|---|---|
| Open | Flanagan Joseph Leo | $650,000 |
Source: Public Records
Tax History
| Year | Tax Paid | Tax Assessment Tax Assessment Total Assessment is a certain percentage of the fair market value that is determined by local assessors to be the total taxable value of land and additions on the property. | Land | Improvement |
|---|---|---|---|---|
| 2025 | $15,239 | $1,329,556 | $1,063,653 | $265,903 |
| 2024 | $15,239 | $1,303,488 | $1,042,798 | $260,690 |
| 2023 | $14,787 | $1,277,930 | $1,022,351 | $255,579 |
| 2022 | $14,535 | $1,252,873 | $1,002,305 | $250,568 |
| 2021 | $14,302 | $1,228,307 | $982,652 | $245,655 |
| 2019 | $13,922 | $1,191,877 | $953,507 | $238,370 |
| 2018 | $13,612 | $1,168,508 | $934,811 | $233,697 |
| 2016 | $12,560 | $1,123,135 | $898,512 | $224,623 |
| 2015 | $12,301 | $1,106,265 | $885,016 | $221,249 |
| 2014 | $12,132 | $1,084,596 | $867,680 | $216,916 |
Source: Public Records
Map
Nearby Homes
- 661 19th St
- 2422 N Ardmore Ave
- 1940 N Ardmore Ave
- 605 Marine Ave
- 2100 Palm Ave
- 642 14th St
- 947 Manhattan Beach
- 844 14th St
- 628 13th St
- 2100 Pine Ave
- 521 13th St
- 3013 Maple Ave
- 448 23rd Place
- 2917 N Poinsettia Ave
- 2317 Elm Ave
- 2508 Pine Ave
- 1140 Fisher Ave
- 1801 Oak Ave
- 525 Manhattan Beach Blvd
- 461 26th St
Your Personal Tour Guide
Ask me questions while you tour the home.