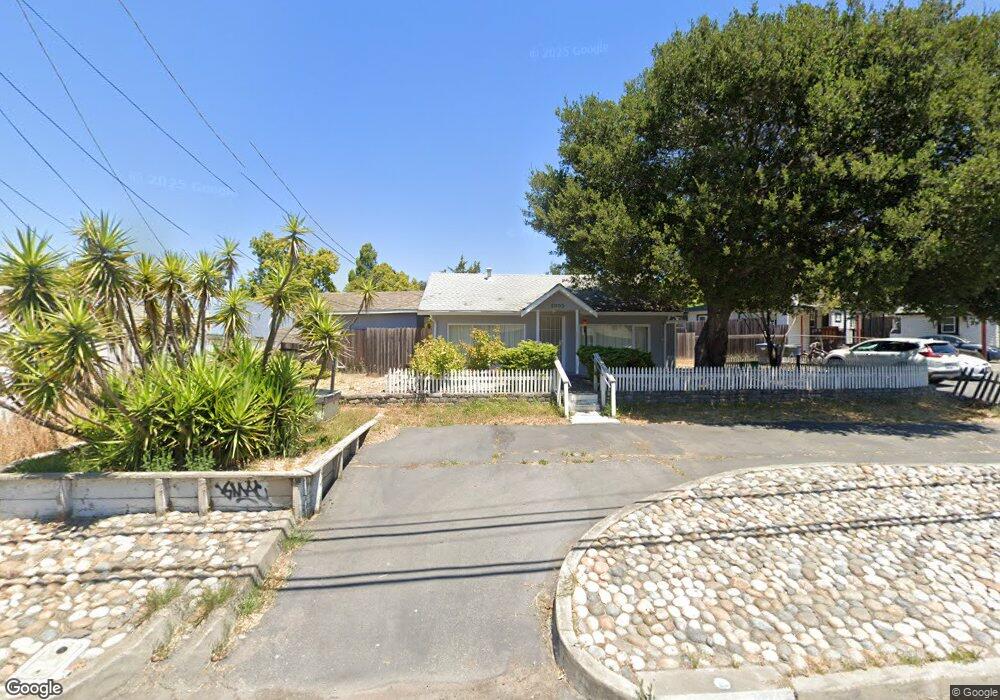
2000 Bodega Ave Petaluma, CA 94952
Estimated Value: $818,504 - $1,070,000
2
Beds
1
Bath
1,461
Sq Ft
$643/Sq Ft
Est. Value
About This Home
This home is located at 2000 Bodega Ave, Petaluma, CA 94952 and is currently estimated at $939,626, approximately $643 per square foot. 2000 Bodega Ave is a home located in Sonoma County with nearby schools including Wilson Elementary School, Petaluma Junior High School, and Petaluma High School.
Ownership History
Date
Name
Owned For
Owner Type
Purchase Details
Closed on
Oct 11, 2023
Sold by
Trout David and Kuss Clairanne
Bought by
Kuss Trout 2023 Trust and Kuss
Current Estimated Value
Purchase Details
Closed on
Nov 25, 2011
Sold by
Trout David and Kuss Clairanne
Bought by
Trout David and Kuss Clairanne
Home Financials for this Owner
Home Financials are based on the most recent Mortgage that was taken out on this home.
Original Mortgage
$189,000
Interest Rate
3.94%
Mortgage Type
New Conventional
Purchase Details
Closed on
Mar 14, 1994
Sold by
Barbieri Jerry and Barbieri Maria
Bought by
Trout David and Kuss Clairanne
Home Financials for this Owner
Home Financials are based on the most recent Mortgage that was taken out on this home.
Original Mortgage
$143,000
Interest Rate
7%
Create a Home Valuation Report for This Property
The Home Valuation Report is an in-depth analysis detailing your home's value as well as a comparison with similar homes in the area
Purchase History
| Date | Buyer | Sale Price | Title Company |
|---|---|---|---|
| Kuss Trout 2023 Trust | -- | None Listed On Document | |
| Trout David | -- | Pacific Coast Title Company | |
| Trout David | $159,000 | First American Title |
Source: Public Records
Mortgage History
| Date | Status | Borrower | Loan Amount |
|---|---|---|---|
| Previous Owner | Trout David | $189,000 | |
| Previous Owner | Trout David | $143,000 |
Source: Public Records
Tax History
| Year | Tax Paid | Tax Assessment Tax Assessment Total Assessment is a certain percentage of the fair market value that is determined by local assessors to be the total taxable value of land and additions on the property. | Land | Improvement |
|---|---|---|---|---|
| 2025 | $3,098 | $267,429 | $142,967 | $124,462 |
| 2024 | $3,098 | $262,186 | $140,164 | $122,022 |
| 2023 | $3,098 | $257,046 | $137,416 | $119,630 |
| 2022 | $2,844 | $252,007 | $134,722 | $117,285 |
| 2021 | $2,781 | $247,067 | $132,081 | $114,986 |
| 2020 | $2,801 | $244,534 | $130,727 | $113,807 |
| 2019 | $2,757 | $239,740 | $128,164 | $111,576 |
| 2018 | $2,741 | $235,040 | $125,651 | $109,389 |
| 2017 | $2,696 | $230,433 | $123,188 | $107,245 |
| 2016 | $2,606 | $225,916 | $120,773 | $105,143 |
| 2015 | $2,586 | $222,523 | $118,959 | $103,564 |
| 2014 | $2,555 | $218,165 | $116,629 | $101,536 |
Source: Public Records
Map
Nearby Homes
- 599 Cleveland Ave
- 2183 Live Oak Farm Ln
- 12 Dorenfeld Ct
- 13 Dorenfeld Ct
- 509 Larch Dr
- 513 Larch Dr
- 716 Elm Dr
- 874 Cherry St
- 65 Freedom Ln N
- 716 Keller Ct
- 142 Cherry St
- 12 Rain Tree Ct
- 100 Orchard Ln
- 12 Haven Dr
- 3150 Skillman Ln
- 136 Court St
- 512 Kentucky St
- 131 Liberty St
- 146 Shelina Vista Ln
- 46 Acorn Cir
Your Personal Tour Guide
Ask me questions while you tour the home.