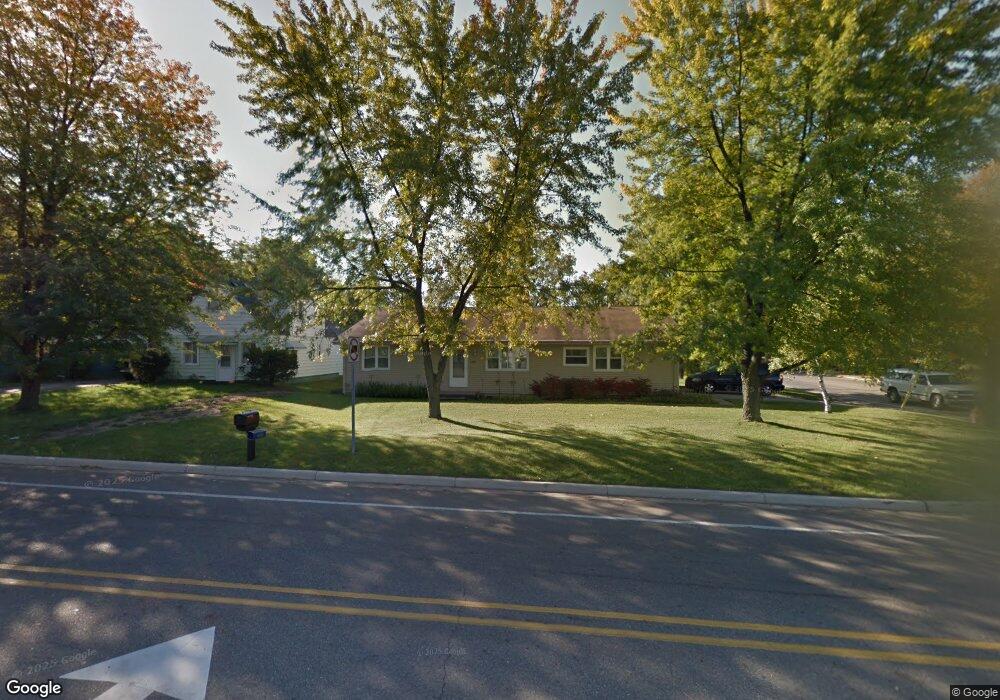
2000 E Cavanaugh Rd Lansing, MI 48910
Forest View NeighborhoodEstimated Value: $146,000 - $209,000
Studio
--
Bath
1,847
Sq Ft
$100/Sq Ft
Est. Value
About This Home
This home is located at 2000 E Cavanaugh Rd, Lansing, MI 48910 and is currently estimated at $184,021, approximately $99 per square foot. 2000 E Cavanaugh Rd is a home located in Ingham County with nearby schools including Forest View School, Pattengill Academy, and Everett High School.
Ownership History
Date
Name
Owned For
Owner Type
Purchase Details
Closed on
Dec 14, 2018
Sold by
Iversen Eric A and Iversen Cynthia L
Bought by
City Of Lansing
Current Estimated Value
Purchase Details
Closed on
Jun 8, 2006
Sold by
Iversen Eric A and Iversen Cynthia L
Bought by
Iversen Eric A and Iversen Cynthia L
Purchase Details
Closed on
Jan 30, 2004
Sold by
Eisenbrandt Rodney L
Bought by
Iversen Eric A and Iversen Cynthia L
Home Financials for this Owner
Home Financials are based on the most recent Mortgage that was taken out on this home.
Original Mortgage
$60,000
Interest Rate
5.74%
Mortgage Type
Purchase Money Mortgage
Purchase Details
Closed on
Oct 24, 2003
Sold by
Eisenbrandt Rodney L and Eisenbrandt Joy E
Bought by
Eisenbrandt Rodney L
Purchase Details
Closed on
Jul 21, 2003
Sold by
Eisenbrandts Adult Foster Care Home Inc
Bought by
Eisenbrandt Rodney L and Eisenbrandt Joy E
Create a Home Valuation Report for This Property
The Home Valuation Report is an in-depth analysis detailing your home's value as well as a comparison with similar homes in the area
Home Values in the Area
Average Home Value in this Area
Purchase History
| Date | Buyer | Sale Price | Title Company |
|---|---|---|---|
| City Of Lansing | $450 | Dba Capital Fund Title Svcs | |
| Iversen Eric A | -- | None Available | |
| Iversen Eric A | $129,500 | Greenridge Realty Chicago Ti | |
| Eisenbrandt Rodney L | $21,000 | -- | |
| Eisenbrandt Rodney L | $35,042 | -- |
Source: Public Records
Mortgage History
| Date | Status | Borrower | Loan Amount |
|---|---|---|---|
| Previous Owner | Iversen Eric A | $60,000 |
Source: Public Records
Tax History
| Year | Tax Paid | Tax Assessment Tax Assessment Total Assessment is a certain percentage of the fair market value that is determined by local assessors to be the total taxable value of land and additions on the property. | Land | Improvement |
|---|---|---|---|---|
| 2025 | $3,526 | $101,900 | $13,400 | $88,500 |
| 2024 | $28 | $96,100 | $13,400 | $82,700 |
| 2023 | $3,305 | $89,000 | $13,400 | $75,600 |
| 2022 | $2,978 | $59,400 | $11,200 | $48,200 |
| 2021 | $2,916 | $59,700 | $5,700 | $54,000 |
| 2020 | $2,898 | $57,400 | $5,700 | $51,700 |
| 2019 | $2,779 | $50,400 | $5,800 | $44,600 |
| 2018 | $2,603 | $46,400 | $5,800 | $40,600 |
| 2017 | $2,493 | $46,400 | $5,800 | $40,600 |
| 2016 | $2,436 | $43,800 | $5,800 | $38,000 |
| 2015 | $2,436 | $43,200 | $11,542 | $31,658 |
| 2014 | $2,436 | $43,500 | $5,079 | $38,421 |
Source: Public Records
Map
Nearby Homes
- 2110 Worden St
- 2018 Worden St
- 2017 Greenwich Ct Unit 20
- 3527 Ruth Ave
- 0 N Aurelius Rd
- 000 Dunckel Rd
- 1101 Kendon Dr
- 4608 Alpha St
- 2127 Robinson Rd
- 3116 Manley Dr
- 4719 S Pennsylvania Ave
- 0 Glenwood Ave
- 3907 Glenwood Ave
- 1109 Barr Ave
- 810 Fenton St
- 1115 Shirley St
- 817 Jessop Ave
- 3603 Parkway Dr
- 709 Jessop Ave
- 2015 Forest Rd
- 2010 E Cavanaugh Rd
- 2020 E Cavanaugh Rd
- 4300 Aurelius Rd
- 4327 Aurelius Rd
- 2022 E Cavanaugh Rd
- 4403 Aurelius Rd
- 2032 E Cavanaugh Rd
- 4411 N Aurelius Rd
- 4411 Aurelius Rd
- 4207 Aurelius Rd
- 4207 N Aurelius Rd
- 4419 N Aurelius Rd
- 4419 Aurelius Rd
- 4230 Chickory Ln
- 4222 Chickory Ln
- 2104 E Cavanaugh Rd
- 4429 Aurelius Rd
- 4429 N Aurelius Rd
- 4216 Chickory Ln
- 4111 Aurelius Rd
Your Personal Tour Guide
Ask me questions while you tour the home.