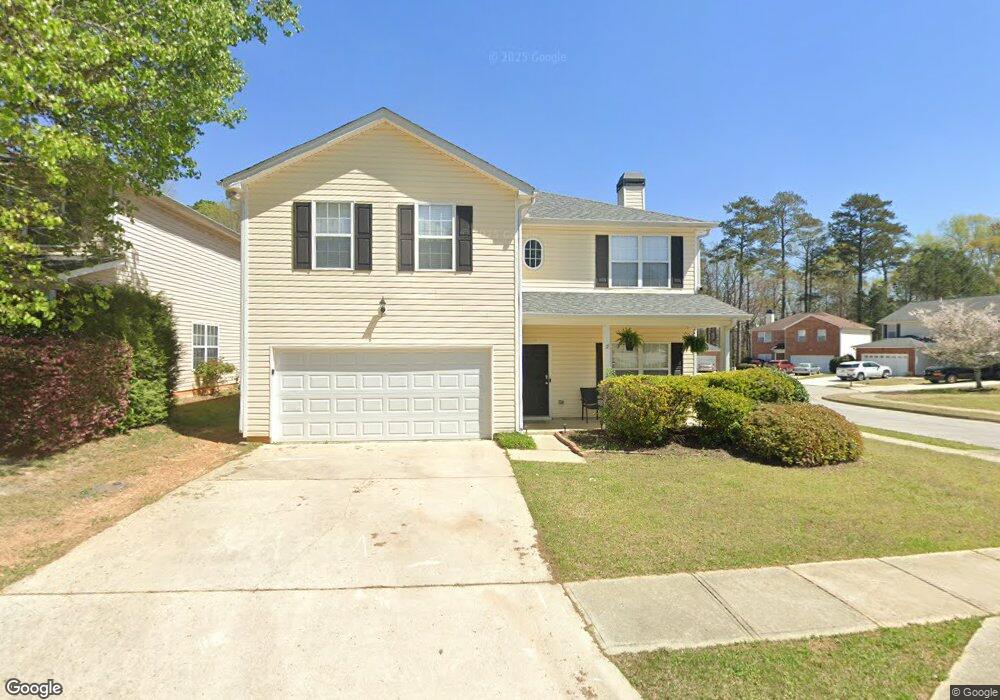
2000 Farm Hill Ct Unit 2 Stockbridge, GA 30281
Estimated Value: $297,985 - $321,000
4
Beds
3
Baths
2,090
Sq Ft
$149/Sq Ft
Est. Value
About This Home
This home is located at 2000 Farm Hill Ct Unit 2, Stockbridge, GA 30281 and is currently estimated at $310,996, approximately $148 per square foot. 2000 Farm Hill Ct Unit 2 is a home located in Henry County with nearby schools including Red Oak Elementary School, Dutchtown Middle School, and Dutchtown High School.
Ownership History
Date
Name
Owned For
Owner Type
Purchase Details
Closed on
Jul 21, 2020
Sold by
Sfr Jv 1 Property Llc
Bought by
Sfr Jv 1 2020 1 Borrower Llc
Current Estimated Value
Purchase Details
Closed on
Mar 27, 2019
Sold by
League Johnny R
Bought by
Sfr Jv 1 Property Llc
Purchase Details
Closed on
Oct 21, 2005
Sold by
Ctx Mtg Co Llc
Bought by
Nixon Lynn
Home Financials for this Owner
Home Financials are based on the most recent Mortgage that was taken out on this home.
Original Mortgage
$99,400
Interest Rate
6.23%
Mortgage Type
New Conventional
Purchase Details
Closed on
Jun 1, 2004
Sold by
Hermes Sanon C
Bought by
Cts Mortgage Co Llc
Purchase Details
Closed on
Mar 31, 2003
Sold by
Centex Homes
Bought by
Hermes Sanon G
Home Financials for this Owner
Home Financials are based on the most recent Mortgage that was taken out on this home.
Original Mortgage
$154,839
Interest Rate
5.62%
Mortgage Type
FHA
Create a Home Valuation Report for This Property
The Home Valuation Report is an in-depth analysis detailing your home's value as well as a comparison with similar homes in the area
Home Values in the Area
Average Home Value in this Area
Purchase History
| Date | Buyer | Sale Price | Title Company |
|---|---|---|---|
| Sfr Jv 1 2020 1 Borrower Llc | -- | -- | |
| Sfr Jv 1 Property Llc | $170,000 | -- | |
| Nixon Lynn | $142,000 | -- | |
| Cts Mortgage Co Llc | $170,087 | -- | |
| Hermes Sanon G | $157,300 | -- |
Source: Public Records
Mortgage History
| Date | Status | Borrower | Loan Amount |
|---|---|---|---|
| Previous Owner | Nixon Lynn | $99,400 | |
| Previous Owner | Hermes Sanon G | $154,839 |
Source: Public Records
Tax History Compared to Growth
Tax History
| Year | Tax Paid | Tax Assessment Tax Assessment Total Assessment is a certain percentage of the fair market value that is determined by local assessors to be the total taxable value of land and additions on the property. | Land | Improvement |
|---|---|---|---|---|
| 2025 | $4,904 | $118,680 | $14,734 | $103,946 |
| 2024 | $4,904 | $118,680 | $16,000 | $102,680 |
| 2023 | $5,171 | $122,680 | $12,000 | $110,680 |
| 2022 | $4,047 | $99,920 | $12,000 | $87,920 |
| 2021 | $3,198 | $77,640 | $12,000 | $65,640 |
| 2020 | $2,832 | $68,000 | $9,996 | $58,004 |
| 2019 | $2,606 | $63,680 | $10,000 | $53,680 |
| 2018 | $2,454 | $59,720 | $10,000 | $49,720 |
| 2016 | $2,198 | $53,040 | $10,000 | $43,040 |
| 2015 | $2,037 | $47,360 | $7,200 | $40,160 |
| 2014 | $1,796 | $40,800 | $7,200 | $33,600 |
Source: Public Records
Map
Nearby Homes
- 719 Nightwind Way
- 1653 Jersey Dr
- 300 Monarch Village Way
- 198 Broder Farms Dr
- 1545 Brangus Dr
- 4025 Jamaica Dr
- 591 Creek Valley Ct
- 1341 Kent Manor Unit 3
- 924 Dexter Dr
- 3916 Champagne Dr
- 213 Sunderland Way Unit 1
- 139 Surge Stone Ln
- 266 Monarch Village Way
- 687 Pathwood Ln
- 1468 Flippen Rd
- 125 Oak Leaf Dr
- 512 Chaucer Way Unit 1
- 1448 Flippen Rd
- 20 Lisa Ct
- 469 Village Cir
- 2000 Farm Hill Ct
- 2000 Farm Hill Ct
- 2002 Farm Hill Ct
- 2004 Farm Hill Ct
- 1907 Chadberry Walk
- 0 Farm Hill Ct Unit 7511976
- 0 Farm Hill Ct Unit 7565968
- 0 Farm Hill Ct
- 1910 Chadberry Walk
- 2001 Farm Hill Ct
- 2001 Farm Hill Ct Unit N/
- 1909 Chadberry Walk
- 2006 Farm Hill Ct
- 1912 Chadberry Walk
- 1912 Chadberry Walk
- 2003 Farm Hill Ct
- 0 Chadberry Walk Unit 7536676
- 1908 Chadberry Walk
- 2005 Farm Hill Ct
- 1911 Chadberry Walk