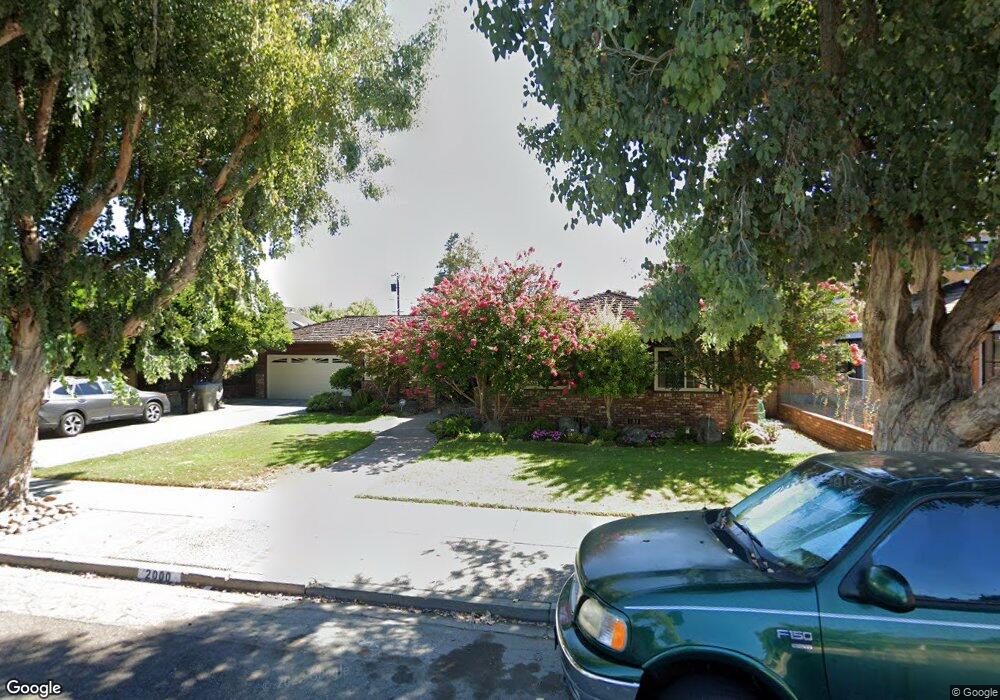
2000 James Place San Jose, CA 95125
Willow Glen NeighborhoodEstimated Value: $2,075,000 - $2,153,000
3
Beds
3
Baths
1,567
Sq Ft
$1,338/Sq Ft
Est. Value
About This Home
This home is located at 2000 James Place, San Jose, CA 95125 and is currently estimated at $2,096,923, approximately $1,338 per square foot. 2000 James Place is a home located in Santa Clara County with nearby schools including Booksin Elementary, Willow Glen Middle, and Willow Glen High School.
Ownership History
Date
Name
Owned For
Owner Type
Purchase Details
Closed on
Feb 14, 2002
Sold by
Okane Kathleen J
Bought by
Okane Kathleen J
Current Estimated Value
Home Financials for this Owner
Home Financials are based on the most recent Mortgage that was taken out on this home.
Original Mortgage
$353,000
Interest Rate
6.62%
Purchase Details
Closed on
Dec 11, 2001
Sold by
Okane Kathleen J
Bought by
Okane Kathleen J
Purchase Details
Closed on
Dec 1, 2000
Sold by
Okane Michael D And Kathleen J Trustee
Bought by
Okane Kathleen J
Home Financials for this Owner
Home Financials are based on the most recent Mortgage that was taken out on this home.
Original Mortgage
$350,000
Interest Rate
7.66%
Purchase Details
Closed on
Aug 7, 1997
Sold by
Okane Michael D and Okane Kathleen J
Bought by
Okane Michael D and Okane Kathleen J
Create a Home Valuation Report for This Property
The Home Valuation Report is an in-depth analysis detailing your home's value as well as a comparison with similar homes in the area
Home Values in the Area
Average Home Value in this Area
Purchase History
| Date | Buyer | Sale Price | Title Company |
|---|---|---|---|
| Okane Kathleen J | -- | Commonwealth Land Title Co | |
| Okane Kathleen J | -- | Commonwealth Land Title Co | |
| Okane Kathleen J | -- | -- | |
| Okane Kathleen J | -- | Fidelity National Title Co | |
| Okane Michael D | -- | -- | |
| Okane Michael D | -- | -- |
Source: Public Records
Mortgage History
| Date | Status | Borrower | Loan Amount |
|---|---|---|---|
| Closed | Okane Kathleen J | $353,000 | |
| Closed | Okane Kathleen J | $350,000 |
Source: Public Records
Tax History Compared to Growth
Tax History
| Year | Tax Paid | Tax Assessment Tax Assessment Total Assessment is a certain percentage of the fair market value that is determined by local assessors to be the total taxable value of land and additions on the property. | Land | Improvement |
|---|---|---|---|---|
| 2025 | $4,169 | $236,549 | $79,700 | $156,849 |
| 2024 | $4,169 | $231,912 | $78,138 | $153,774 |
| 2023 | $4,053 | $227,365 | $76,606 | $150,759 |
| 2022 | $4,017 | $222,907 | $75,104 | $147,803 |
| 2021 | $3,884 | $218,537 | $73,632 | $144,905 |
| 2020 | $3,755 | $216,297 | $72,877 | $143,420 |
| 2019 | $3,653 | $212,057 | $71,449 | $140,608 |
| 2018 | $3,596 | $207,900 | $70,049 | $137,851 |
| 2017 | $3,517 | $200,883 | $68,676 | $132,207 |
| 2016 | $3,373 | $196,945 | $67,330 | $129,615 |
| 2015 | $3,336 | $193,988 | $66,319 | $127,669 |
| 2014 | $2,915 | $190,189 | $65,020 | $125,169 |
Source: Public Records
Map
Nearby Homes
- 1430 Callecita St
- 1898 Meridian Ave Unit 29
- 2425 Briarwood Dr
- 2322 Meridian Ave
- 1735 Whispering Willow Place
- 1665 Fairorchard Ave
- 2536 Malaga Dr
- 1327 Pine Ave
- 2498 Raleigh Dr
- 1829 Cabana Dr
- 1549 Keesling Ave
- 1705 Harte Dr
- 1629 Glenfield Dr
- 1655 Everett Ave
- 1791 Frobisher Way
- 1566 Larkspur Dr
- 1247 Curtner Ave
- 1741 Harte Dr
- 2265 Mazzaglia Ave
- 1632 Trona Way
- 1984 James Place
- 2001 Booksin Ave
- 2021 Booksin Ave
- 1985 Booksin Ave
- 1831 Georgetta Dr
- 1970 James Place
- 2001 James Place
- 1815 Georgetta Dr
- 1985 James Place
- 2021 James Place
- 1971 Booksin Ave
- 1956 James Place
- 1971 James Place
- 2041 James Place
- 1957 Booksin Ave
- 1957 James Place
- 2004 Adele Place
- 1942 James Place
- 2032 Adele Place
- 1820 Georgetta Dr