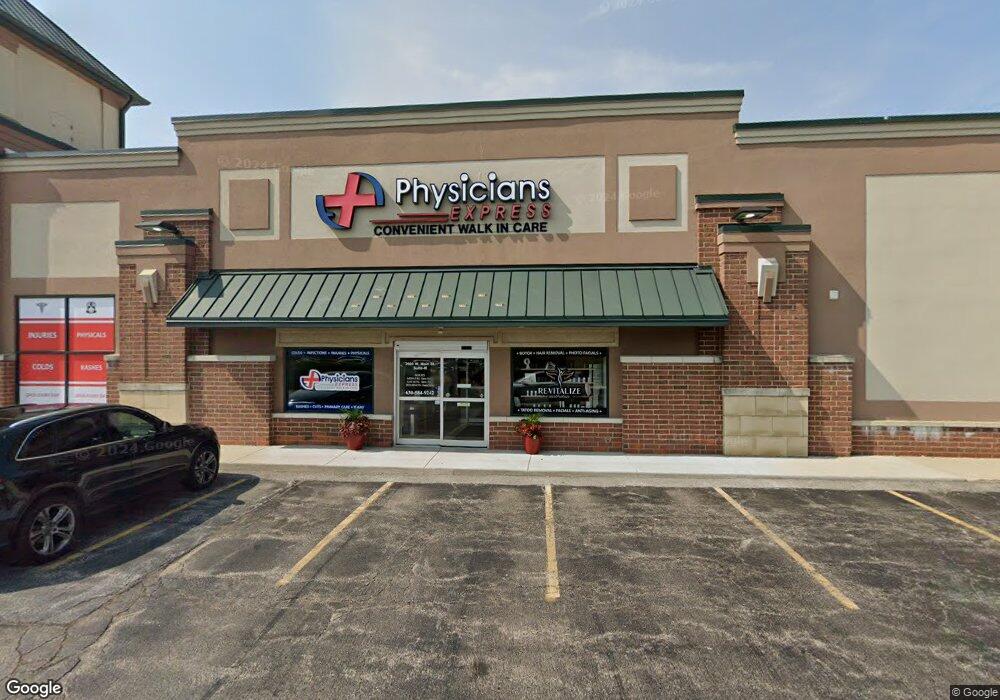
2000 W Main St Unit G Saint Charles, IL 60174
Southwest Saint Charles NeighborhoodEstimated Value: $517,723
--
Bed
--
Bath
--
Sq Ft
6,795
Sq Ft Lot
About This Home
This home is located at 2000 W Main St Unit G, Saint Charles, IL 60174 and is currently estimated at $517,723. 2000 W Main St Unit G is a home located in Kane County with nearby schools including Wild Rose Elementary School, Thompson Middle School, and St Charles East High School.
Ownership History
Date
Name
Owned For
Owner Type
Purchase Details
Closed on
Aug 20, 2014
Sold by
Melrose Holdings 2 Llc
Bought by
Illinois Property Group Llc Series I
Current Estimated Value
Purchase Details
Closed on
Feb 4, 2013
Sold by
Mortgage Group Advisors Inc
Bought by
Melrose Holdings 2 Llc
Purchase Details
Closed on
Apr 1, 2002
Sold by
Fifth Third Bank
Bought by
Mortgage Group Advisors Inc
Home Financials for this Owner
Home Financials are based on the most recent Mortgage that was taken out on this home.
Original Mortgage
$365,000
Interest Rate
6.93%
Mortgage Type
Commercial
Purchase Details
Closed on
Jan 27, 2000
Sold by
Lochmann Agnes
Bought by
Old Kent Bank and Trust #16539
Home Financials for this Owner
Home Financials are based on the most recent Mortgage that was taken out on this home.
Original Mortgage
$265,000
Interest Rate
9%
Mortgage Type
Commercial
Purchase Details
Closed on
Jun 2, 1999
Sold by
Walnut Street Partners Llc
Bought by
Lochmann Agnes C
Create a Home Valuation Report for This Property
The Home Valuation Report is an in-depth analysis detailing your home's value as well as a comparison with similar homes in the area
Home Values in the Area
Average Home Value in this Area
Purchase History
| Date | Buyer | Sale Price | Title Company |
|---|---|---|---|
| Illinois Property Group Llc Series I | $260,000 | Chicago Title Insurance Co | |
| Melrose Holdings 2 Llc | -- | Chicago Title Insurance Comp | |
| Mortgage Group Advisors Inc | $457,000 | Chicago Title Insurance Co | |
| Old Kent Bank | $249,000 | Chicago Title Insurance Co | |
| Lochmann Agnes C | $249,000 | Chicago Title Insurance Co |
Source: Public Records
Mortgage History
| Date | Status | Borrower | Loan Amount |
|---|---|---|---|
| Previous Owner | Mortgage Group Advisors Inc | $365,000 | |
| Previous Owner | Old Kent Bank | $265,000 |
Source: Public Records
Tax History Compared to Growth
Tax History
| Year | Tax Paid | Tax Assessment Tax Assessment Total Assessment is a certain percentage of the fair market value that is determined by local assessors to be the total taxable value of land and additions on the property. | Land | Improvement |
|---|---|---|---|---|
| 2024 | $9,761 | $131,488 | $38,024 | $93,464 |
| 2023 | $9,419 | $117,684 | $34,032 | $83,652 |
| 2022 | $10,061 | $124,603 | $33,903 | $90,700 |
| 2021 | $9,687 | $118,771 | $32,316 | $86,455 |
| 2020 | $9,593 | $116,556 | $31,713 | $84,843 |
| 2019 | $9,429 | $114,248 | $31,085 | $83,163 |
| 2018 | $9,376 | $113,032 | $29,534 | $83,498 |
| 2017 | $9,147 | $109,167 | $28,525 | $80,642 |
| 2016 | $9,623 | $105,333 | $27,523 | $77,810 |
| 2015 | -- | $104,197 | $27,226 | $76,971 |
| 2014 | -- | $102,773 | $27,226 | $75,547 |
| 2013 | -- | $66,138 | $27,498 | $38,640 |
Source: Public Records
Map
Nearby Homes
- 921 Oak Crest Ln Unit 1
- 1330-1332 S 14th St
- 1336-1338 S 14th St
- 3108 Saint Michel Ln
- 1108 S 12th St Unit 2
- 3N866 Ferson Creek Rd
- 231 Sedgewick Cir
- 205 Auburn Ct Unit 205
- 3208 Raphael Ct
- 3024 Langston Cir
- 290 Remington Dr
- 171 Birch Ln
- 3386 Saint Michel Ct
- 528 Horizon Dr W
- 806 Fellows St
- 560 Renee Ct
- 1017 S 6th St
- 50 S 1st St Unit 5D
- 1028 S 5th St
- 3534 Matisse Dr
- 2000 W Main St Unit F
- 2000 W Main St Unit H
- 2002 W Main St Unit P
- 2002 W Main St Unit Q
- 1901 W Main St
- 37W782 W Main St
- 1900 W Main St
- 1840 W Main St
- 1890 W Main St
- 115 Walnut Dr Unit D110
- 115 Walnut Dr
- 115 Walnut Dr Unit D211
- 115 Walnut Dr Unit D229
- 120 Walnut Dr Unit 7
- 114 Walnut Dr
- 1822 Walnut St
- 1909 Walnut St
- 124 Walnut Dr Unit 7
- 2 Randall Rd
- 1903 Walnut St