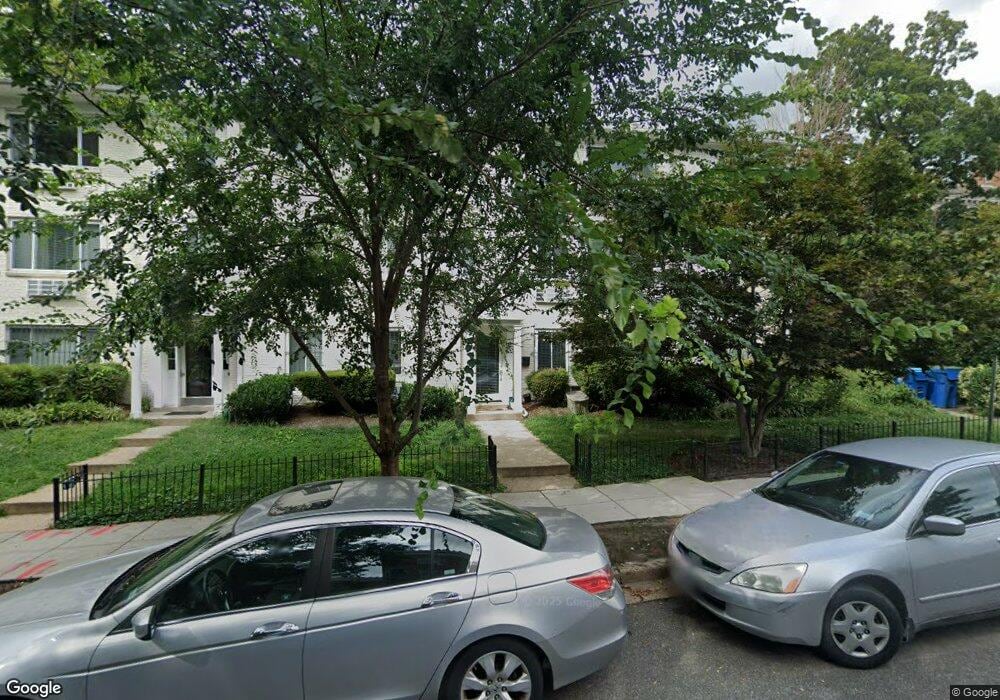
2001 Allen Place NW Unit 2005 Washington, DC 20009
Kalorama Triangle NeighborhoodEstimated Value: $265,000 - $314,000
1
Bed
1
Bath
408
Sq Ft
$729/Sq Ft
Est. Value
About This Home
This home is located at 2001 Allen Place NW Unit 2005, Washington, DC 20009 and is currently estimated at $297,284, approximately $728 per square foot. 2001 Allen Place NW Unit 2005 is a home located in District of Columbia with nearby schools including Oyster-Adams Bilingual School, Sequoia Union Elementary, and Jackson Reed High School.
Ownership History
Date
Name
Owned For
Owner Type
Purchase Details
Closed on
Jan 24, 2019
Sold by
Brown Julia
Bought by
Nohelty Sean P
Current Estimated Value
Home Financials for this Owner
Home Financials are based on the most recent Mortgage that was taken out on this home.
Original Mortgage
$196,800
Outstanding Balance
$172,682
Interest Rate
4.6%
Mortgage Type
New Conventional
Estimated Equity
$124,602
Purchase Details
Closed on
Aug 15, 2014
Sold by
Snyder Gregory
Bought by
Guinand Laurent and Guinand Alessandra D S
Home Financials for this Owner
Home Financials are based on the most recent Mortgage that was taken out on this home.
Original Mortgage
$186,750
Interest Rate
4.14%
Mortgage Type
New Conventional
Purchase Details
Closed on
Mar 22, 2011
Sold by
Jackson Brent E
Bought by
Snyder Gregory
Purchase Details
Closed on
Dec 12, 2008
Sold by
Allen Place Llc
Bought by
Jackson Brent E and Ramezan-Jackson,Andrea
Home Financials for this Owner
Home Financials are based on the most recent Mortgage that was taken out on this home.
Original Mortgage
$170,100
Interest Rate
6.49%
Mortgage Type
New Conventional
Create a Home Valuation Report for This Property
The Home Valuation Report is an in-depth analysis detailing your home's value as well as a comparison with similar homes in the area
Home Values in the Area
Average Home Value in this Area
Purchase History
| Date | Buyer | Sale Price | Title Company |
|---|---|---|---|
| Nohelty Sean P | $246,000 | Kvs Title Llc | |
| Guinand Laurent | -- | -- | |
| Snyder Gregory | $225,000 | -- | |
| Jackson Brent E | $189,000 | -- |
Source: Public Records
Mortgage History
| Date | Status | Borrower | Loan Amount |
|---|---|---|---|
| Open | Nohelty Sean P | $196,800 | |
| Previous Owner | Guinand Laurent | $186,750 | |
| Previous Owner | Jackson Brent E | $170,100 |
Source: Public Records
Tax History Compared to Growth
Tax History
| Year | Tax Paid | Tax Assessment Tax Assessment Total Assessment is a certain percentage of the fair market value that is determined by local assessors to be the total taxable value of land and additions on the property. | Land | Improvement |
|---|---|---|---|---|
| 2025 | $2,282 | $284,150 | $85,240 | $198,910 |
| 2024 | $2,718 | $334,920 | $100,480 | $234,440 |
| 2023 | $2,402 | $297,320 | $89,200 | $208,120 |
| 2022 | $2,219 | $274,810 | $82,440 | $192,370 |
| 2021 | $2,238 | $276,570 | $82,970 | $193,600 |
| 2020 | $2,626 | $308,970 | $92,690 | $216,280 |
| 2019 | $2,606 | $306,600 | $91,980 | $214,620 |
| 2018 | $2,450 | $288,260 | $0 | $0 |
| 2017 | $2,405 | $282,990 | $0 | $0 |
| 2016 | $2,068 | $243,300 | $0 | $0 |
| 2015 | $2,230 | $262,330 | $0 | $0 |
| 2014 | $1,989 | $233,960 | $0 | $0 |
Source: Public Records
Map
Nearby Homes
- 2456 20th St NW Unit 507
- 2456 20th St NW Unit 403
- 1918 Belmont Rd NW
- 2332 19th St NW
- 1953 Calvert St NW Unit D
- 1840 Mintwood Place NW Unit 402
- 2516 Cliffbourne Place NW
- 1855 Calvert St NW Unit 203
- 1851 Columbia Rd NW Unit 303
- 1851 Columbia Rd NW Unit 305
- 1903 Kalorama Rd NW
- 2630 Adams Mill Rd NW Unit T06
- 2220 20th St NW Unit 46
- 1880 Columbia Rd NW Unit 204
- 1852 Columbia Rd NW Unit 101
- 2010 Kalorama Rd NW Unit 306
- 1830 Columbia Rd NW
- 2627 Adams Mill Rd NW Unit 403
- 2101 Connecticut Ave NW Unit 53
- 2101 Connecticut Ave NW Unit 24
- 2001 Allen Place NW Unit 2005
- 2001 Allen Place NW Unit 2005
- 2001 Allen Place NW Unit 2005
- 2001 Allen Place NW Unit 2005
- 2001 Allen Place NW Unit 2005
- 2001 Allen Place NW Unit 2005
- 2001 Allen Place NW Unit 2005
- 2001 Allen Place NW Unit 203
- 2001 Allen Place NW Unit 102
- 2003 Allen Place NW Unit 201
- 2003 Allen Place NW Unit 101
- 2003 Allen Place NW Unit 202
- 2003 Allen Place NW Unit 303
- 2003 Allen Place NW Unit 302
- 2428 20th St NW
- 2430 20th St NW
- 2432 20th St NW
- 2432 20th St NW Unit ID1037739P
- 2432 20th St NW
- 2005 Allen Place NW Unit CONV