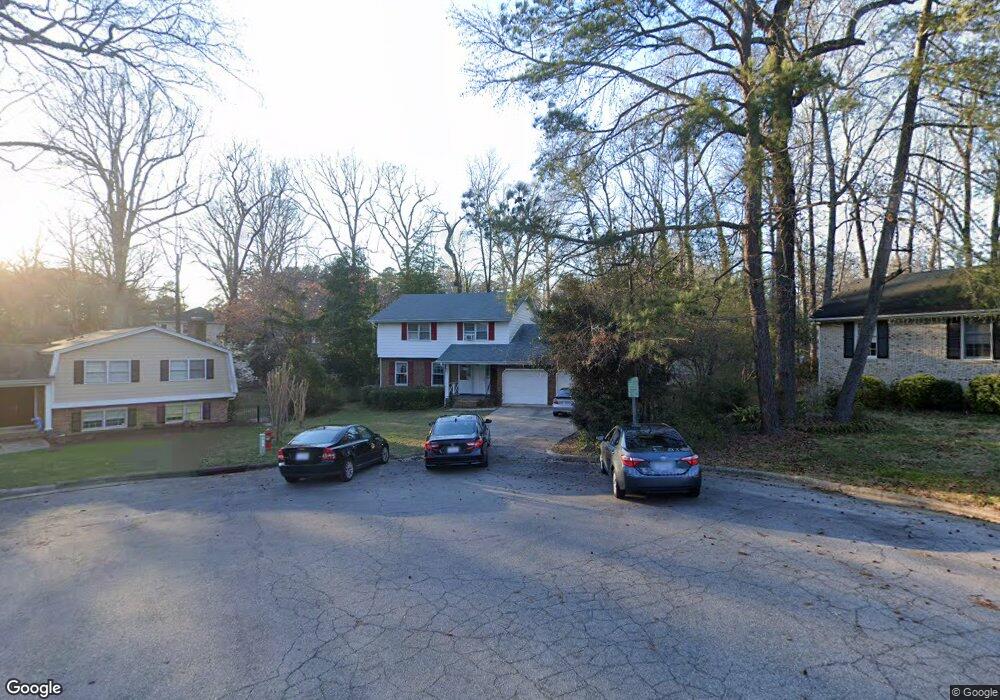
2001 Eagleton Cir Raleigh, NC 27609
North Ridge NeighborhoodEstimated Value: $517,000 - $550,000
4
Beds
3
Baths
2,134
Sq Ft
$248/Sq Ft
Est. Value
About This Home
This home is located at 2001 Eagleton Cir, Raleigh, NC 27609 and is currently estimated at $529,960, approximately $248 per square foot. 2001 Eagleton Cir is a home located in Wake County with nearby schools including Millbrook Elementary School, East Millbrook Middle, and Millbrook High School.
Ownership History
Date
Name
Owned For
Owner Type
Purchase Details
Closed on
Feb 18, 2022
Sold by
Raymond Spanjers Andrew and Raymond Sayena
Bought by
Spanjers Andrew Raymond and Davarpenah Sayena
Current Estimated Value
Purchase Details
Closed on
Nov 19, 2020
Sold by
Sadat Abdul H and Rashidi Simeen
Bought by
Spanjers Andrew Raymond and Davearpanah Sayena
Home Financials for this Owner
Home Financials are based on the most recent Mortgage that was taken out on this home.
Original Mortgage
$260,000
Interest Rate
2.8%
Mortgage Type
New Conventional
Purchase Details
Closed on
Aug 14, 1998
Sold by
Myers Geoffry R
Bought by
Sadat Abdul H and Sadat Simeen
Home Financials for this Owner
Home Financials are based on the most recent Mortgage that was taken out on this home.
Original Mortgage
$127,200
Interest Rate
6.97%
Create a Home Valuation Report for This Property
The Home Valuation Report is an in-depth analysis detailing your home's value as well as a comparison with similar homes in the area
Home Values in the Area
Average Home Value in this Area
Purchase History
| Date | Buyer | Sale Price | Title Company |
|---|---|---|---|
| Spanjers Andrew Raymond | -- | None Listed On Document | |
| Spanjers Andrew Raymond | $305,000 | None Available | |
| Spanjers Andrew Raymond | $305,000 | None Listed On Document | |
| Sadat Abdul H | $159,000 | -- |
Source: Public Records
Mortgage History
| Date | Status | Borrower | Loan Amount |
|---|---|---|---|
| Previous Owner | Spanjers Andrew Raymond | $260,000 | |
| Previous Owner | Sadat Abdul H | $127,200 |
Source: Public Records
Tax History
| Year | Tax Paid | Tax Assessment Tax Assessment Total Assessment is a certain percentage of the fair market value that is determined by local assessors to be the total taxable value of land and additions on the property. | Land | Improvement |
|---|---|---|---|---|
| 2025 | $4,120 | $470,152 | $200,000 | $270,152 |
| 2024 | $4,103 | $470,152 | $200,000 | $270,152 |
Source: Public Records
Map
Nearby Homes
- 5721 Timber Ridge Dr
- 2104 Quail Ridge Rd
- 5620 Old Forge Cir
- 5810 Shady Grove Cir
- 1900 Township Cir
- 5812 Old Forge Cir
- 1720 Township Cir
- 5509 Old Forge Cir
- 1748 Quail Ridge Rd
- 5530 Forest Oaks Dr
- 5602 Falls of Neuse Rd Unit A
- 5804 Nottoway Ct Unit E
- 6309 Johnsdale Rd
- 5612 Falls of Neuse Rd Unit D
- 1209 Manassas Ct Unit C
- 5604 Falls of Neuse Rd Unit H
- 5612 Falls of Neuse Rd Unit H
- 1217 H Manassas Ct Unit H
- 1516 Hemphill Dr
- 1511 Hemphill Dr
- 2005 Eagleton Cir
- 5704 Partridge Ln
- 2000 Eagleton Cir
- 5708 Partridge Ln
- 2004 Mallard Ln
- 2009 Eagleton Cir
- 2008 Mallard Ln
- 5712 Partridge Ln
- 2004 Eagleton Cir
- 5608 Partridge Ln
- 2008 Eagleton Cir
- 2012 Mallard Ln
- 1905 Bobwhite Ct
- 5604 Partridge Ln
- 2012 Eagleton Cir
- 5705 Partridge Ln
- 2016 Mallard Ln
- 5701 Partridge Ln
- 5709 Partridge Ln
- 1908 Bobwhite Ct
Your Personal Tour Guide
Ask me questions while you tour the home.