Estimated Value: $929,484
Studio
--
Bath
8,530
Sq Ft
$109/Sq Ft
Est. Value
About This Home
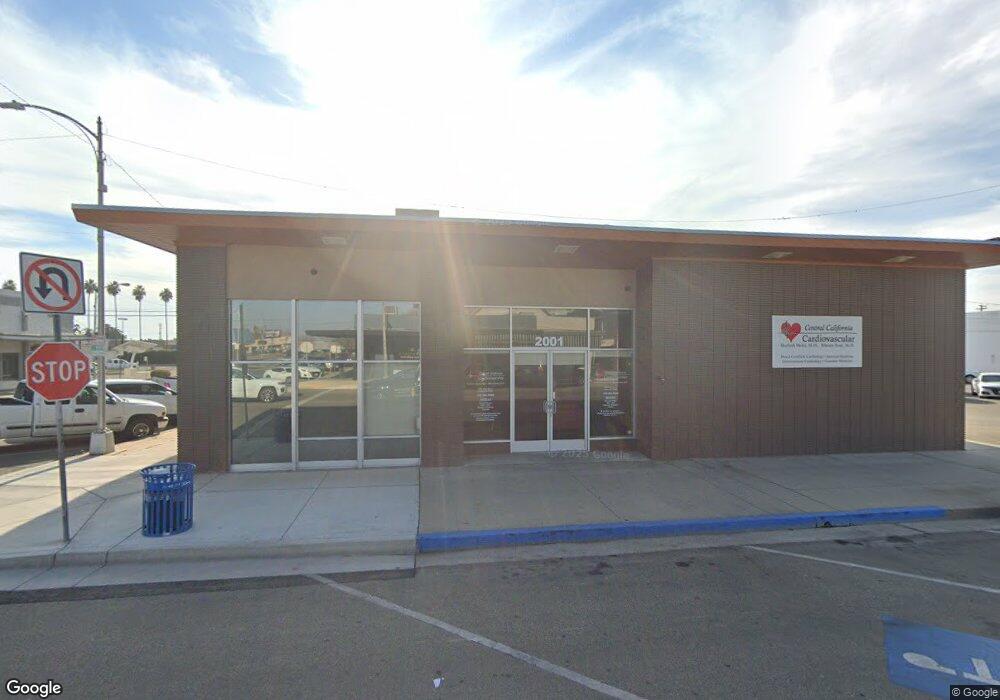
This home is located at 2001 High St, Selma, CA 93662 and is currently estimated at $929,484, approximately $108 per square foot. 2001 High St is a home located in Fresno County with nearby schools including James Garfield Elementary School, Abraham Lincoln Middle School, and Selma High School.
Ownership History
Date
Name
Owned For
Owner Type
Purchase Details
Closed on
Mar 6, 2012
Sold by
Raven Larry J and Raven Patricia E
Bought by
Gsn Investment Group Llc
Current Estimated Value
Purchase Details
Closed on
May 17, 2011
Sold by
Westamerica Bank
Bought by
Raven Larry J and Raven Patricia E
Purchase Details
Closed on
Jan 20, 2011
Sold by
Lambert Alan G
Bought by
Westamerica Bank
Create a Home Valuation Report for This Property
The Home Valuation Report is an in-depth analysis detailing your home's value as well as a comparison with similar homes in the area
Home Values in the Area
Average Home Value in this Area
Purchase History
| Date | Buyer | Sale Price | Title Company |
|---|---|---|---|
| Gsn Investment Group Llc | $310,000 | Chicago Title Company | |
| Raven Larry J | $265,000 | Chicago Title Company | |
| Rima Chris A | -- | Chicago Title Company | |
| Westamerica Bank | $215,000 | None Available |
Source: Public Records
Tax History
| Year | Tax Paid | Tax Assessment Tax Assessment Total Assessment is a certain percentage of the fair market value that is determined by local assessors to be the total taxable value of land and additions on the property. | Land | Improvement |
|---|---|---|---|---|
| 2025 | $5,199 | $389,364 | $156,999 | $232,365 |
| 2023 | $4,477 | $374,246 | $150,903 | $223,343 |
| 2022 | $4,195 | $366,909 | $147,945 | $218,964 |
| 2021 | $4,113 | $359,716 | $145,045 | $214,671 |
| 2020 | $4,106 | $356,028 | $143,558 | $212,470 |
| 2019 | $4,032 | $349,048 | $140,744 | $208,304 |
| 2018 | $3,950 | $342,205 | $137,985 | $204,220 |
| 2017 | $3,913 | $335,496 | $135,280 | $200,216 |
| 2016 | $3,508 | $328,919 | $132,628 | $196,291 |
| 2015 | $3,648 | $329,479 | $130,636 | $198,843 |
| 2014 | $3,594 | $323,134 | $128,078 | $195,056 |
Source: Public Records
Map
Nearby Homes
- 0 Rose Ave
- 2226 Arrants St
- 2126 Tulare St
- 2629 Mccall Ave
- 2116 Sylvia St
- 2002 Merced St
- 2772 Valley View St
- 2766 Lee St
- 12623 S Mccall Ave
- 1517 Stillman St
- 2022 Bauder St
- 2221 Floral Ave
- 2510 Whitson St
- 2753 Thompson Ave
- 2561 Stillman St Unit 111
- 1361 Almond St
- 2482 Country Club Ln
- 2405 Country Club Ln
- 1233 Redwood Ln
- 2980 Olive St
Your Personal Tour Guide
Ask me questions while you tour the home.