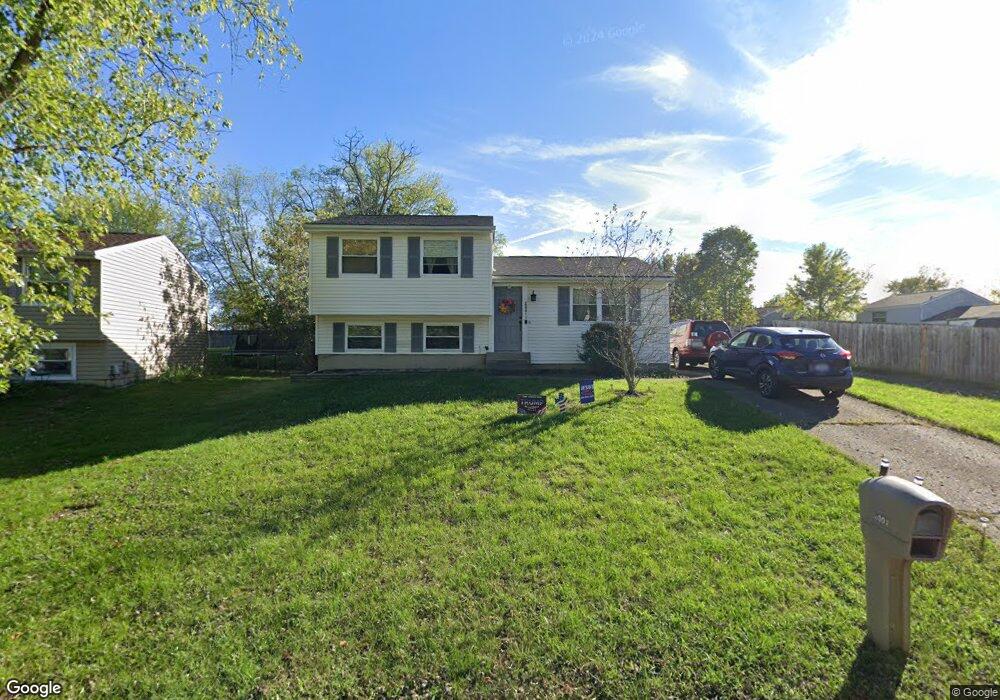
2001 Woodcrest Dr Independence, KY 41051
Estimated Value: $213,000 - $254,000
3
Beds
1
Bath
1,026
Sq Ft
$227/Sq Ft
Est. Value
About This Home
This home is located at 2001 Woodcrest Dr, Independence, KY 41051 and is currently estimated at $232,802, approximately $226 per square foot. 2001 Woodcrest Dr is a home located in Kenton County with nearby schools including Beechgrove Elementary School, Simon Kenton High School, and Zion Christian Academy.
Ownership History
Date
Name
Owned For
Owner Type
Purchase Details
Closed on
Jun 6, 2012
Sold by
Wilson Michael J and Wilson Amy M
Bought by
Tucker Sheila D and Tucker Jacob Lee
Current Estimated Value
Purchase Details
Closed on
Aug 11, 2011
Sold by
Secretary Of Housing & Urban Development
Bought by
Wilson Michael J and Wilson Amy M
Purchase Details
Closed on
Jul 28, 2004
Sold by
Paff Jeremy
Bought by
Paff Jeremy and Paff Brandi
Home Financials for this Owner
Home Financials are based on the most recent Mortgage that was taken out on this home.
Original Mortgage
$109,250
Interest Rate
7.12%
Mortgage Type
New Conventional
Purchase Details
Closed on
Sep 21, 1999
Sold by
Knudson Ora G
Bought by
Paff Jeremy
Home Financials for this Owner
Home Financials are based on the most recent Mortgage that was taken out on this home.
Original Mortgage
$89,400
Interest Rate
7.91%
Mortgage Type
FHA
Create a Home Valuation Report for This Property
The Home Valuation Report is an in-depth analysis detailing your home's value as well as a comparison with similar homes in the area
Home Values in the Area
Average Home Value in this Area
Purchase History
| Date | Buyer | Sale Price | Title Company |
|---|---|---|---|
| Tucker Sheila D | $115,000 | 360 American Title Svcs Llc | |
| Wilson Michael J | $55,800 | Northern Kentucky Title Inc | |
| Paff Jeremy | -- | Landsel Title Agency | |
| Paff Jeremy | $89,500 | -- |
Source: Public Records
Mortgage History
| Date | Status | Borrower | Loan Amount |
|---|---|---|---|
| Previous Owner | Paff Jeremy | $109,250 | |
| Previous Owner | Paff Jeremy | $89,400 |
Source: Public Records
Tax History Compared to Growth
Tax History
| Year | Tax Paid | Tax Assessment Tax Assessment Total Assessment is a certain percentage of the fair market value that is determined by local assessors to be the total taxable value of land and additions on the property. | Land | Improvement |
|---|---|---|---|---|
| 2024 | $1,001 | $128,100 | $25,000 | $103,100 |
| 2023 | $1,031 | $128,100 | $25,000 | $103,100 |
| 2022 | $1,174 | $128,100 | $25,000 | $103,100 |
| 2021 | $1,191 | $128,100 | $25,000 | $103,100 |
| 2020 | $1,060 | $115,000 | $20,000 | $95,000 |
| 2019 | $1,063 | $115,000 | $20,000 | $95,000 |
| 2018 | $1,090 | $115,000 | $20,000 | $95,000 |
| 2017 | $1,062 | $115,000 | $20,000 | $95,000 |
| 2015 | $1,033 | $115,000 | $20,000 | $95,000 |
| 2014 | $1,471 | $115,000 | $20,000 | $95,000 |
Source: Public Records
Map
Nearby Homes
- 1056 Oakwood Ct Unit 3
- 4187 Elder Ct Unit 5
- 4109 Willowview Dr
- 4106 Willowview Dr
- 4102 Willowview Dr
- 9831 Codyview Dr
- 4101 Willowview Dr
- 4245 Briarwood Dr Unit 1
- 1079 Birch Tree Ln
- 4071 Elizabeth Dr
- 622 Badger Ct
- 603 Branch Ct
- 586 Cutter Ln
- 604 Astoria Ct
- 660 Ackerly Dr
- 10690 Melbury Ct Unit 305GL
- 10694 Melbury Ct Unit 306GL
- 10720 Hanover Ct
- The Westchester Plan at The Greens of Glenhurst
- The Ella Marie Plan at The Greens of Glenhurst
- 2003 Woodcrest Dr
- 4804 Wildwood Dr
- 4806 Wildwood Dr
- 2005 Woodcrest Dr
- 4808 Wildwood Dr
- 2000 Woodmeadow Dr
- 2002 Woodmeadow Dr
- 2002 Woodcrest Dr
- 4810 Wildwood Dr
- 4802 Wildwood Dr
- 2007 Woodcrest Dr
- 2004 Woodmeadow Dr
- 2004 Woodcrest Dr
- 14 Woodtop Ct
- 4800 Wildwood Dr
- 2009 Woodcrest Dr
- 2006 Woodcrest Dr
- 4805 Wildwood Dr
- 4807 Wildwood Dr
- 4803 Wildwood Dr