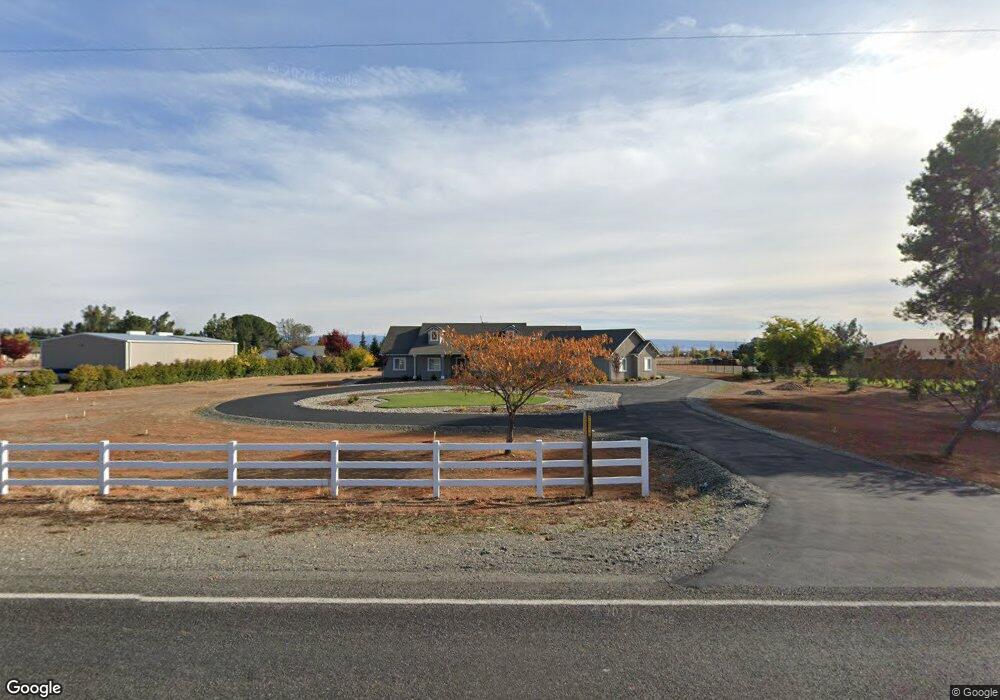
20019 Red Bank Rd Red Bluff, CA 96080
Estimated Value: $551,000 - $690,000
4
Beds
3
Baths
2,475
Sq Ft
$248/Sq Ft
Est. Value
About This Home
This home is located at 20019 Red Bank Rd, Red Bluff, CA 96080 and is currently estimated at $614,938, approximately $248 per square foot. 20019 Red Bank Rd is a home located in Tehama County with nearby schools including William M. Metteer Elementary School, Vista Preparatory Academy, and Red Bluff High School.
Ownership History
Date
Name
Owned For
Owner Type
Purchase Details
Closed on
May 20, 2015
Sold by
Hsbc Bank Usa National Association
Bought by
Lane Daniel J and Lane Miranda V
Current Estimated Value
Home Financials for this Owner
Home Financials are based on the most recent Mortgage that was taken out on this home.
Original Mortgage
$299,250
Interest Rate
3.63%
Mortgage Type
New Conventional
Purchase Details
Closed on
Dec 16, 2014
Sold by
Hayes Patrick S and Hayes Lisamarie
Bought by
Hsbc Bank Usa National Association
Purchase Details
Closed on
Mar 8, 2007
Sold by
Benson John Allen and Benson Medguel Rose
Bought by
Hayes Patrick S and Hayes Lisamarie
Home Financials for this Owner
Home Financials are based on the most recent Mortgage that was taken out on this home.
Original Mortgage
$393,750
Interest Rate
6.29%
Mortgage Type
Purchase Money Mortgage
Create a Home Valuation Report for This Property
The Home Valuation Report is an in-depth analysis detailing your home's value as well as a comparison with similar homes in the area
Home Values in the Area
Average Home Value in this Area
Purchase History
| Date | Buyer | Sale Price | Title Company |
|---|---|---|---|
| Lane Daniel J | $315,000 | Placer Title Company | |
| Hsbc Bank Usa National Association | $250,750 | Accommodation | |
| Hayes Patrick S | $525,000 | Chicago Title Co |
Source: Public Records
Mortgage History
| Date | Status | Borrower | Loan Amount |
|---|---|---|---|
| Previous Owner | Lane Daniel J | $299,250 | |
| Previous Owner | Hayes Patrick S | $393,750 |
Source: Public Records
Tax History Compared to Growth
Tax History
| Year | Tax Paid | Tax Assessment Tax Assessment Total Assessment is a certain percentage of the fair market value that is determined by local assessors to be the total taxable value of land and additions on the property. | Land | Improvement |
|---|---|---|---|---|
| 2025 | $3,815 | $382,947 | $96,143 | $286,804 |
| 2023 | $3,750 | $368,078 | $92,410 | $275,668 |
| 2022 | $3,723 | $360,862 | $90,599 | $270,263 |
| 2021 | $3,572 | $353,787 | $88,823 | $264,964 |
| 2020 | $3,603 | $346,161 | $87,913 | $258,248 |
| 2019 | $3,624 | $339,375 | $86,190 | $253,185 |
| 2018 | $3,350 | $332,721 | $84,500 | $248,221 |
| 2017 | $3,379 | $326,198 | $82,844 | $243,354 |
| 2016 | $3,153 | $319,803 | $81,220 | $238,583 |
| 2015 | $3,013 | $299,000 | $80,000 | $219,000 |
| 2014 | $3,056 | $308,682 | $105,379 | $203,303 |
Source: Public Records
Map
Nearby Homes
- 20050 Plains Dr
- 12072 Alta Vista Ct
- 20225 Stewart Rd
- 20285 Stewart Rd
- 0 Stewart Rd Unit 20250381
- 0 Stewart Rd Unit 20250380
- 19235 Ridge Rd
- 20360 Acorn Ave
- 11565 Wilder Rd
- 12060 Lazy Ln
- 20481 Womack Rd
- 19365 MacHo Rd
- 2093 Stonybrook Dr
- 2050 Stonybrook Dr
- 18920 Reeds Creek Rd
- 13185 Montecito Rd
- 1555 Acacia St
- 1455 Acacia St
- 1339 Britt Ln
- 20013 Red Bank Rd
- 20065 Live Oak Rd
- 20007 Red Bank Rd
- 20020 Red Bank Rd
- 20001 Red Bank Rd
- 20075 Live Oak Rd
- 19962 Ames Ct
- 19965 Ames Ct
- 20070 Live Oak Rd
- 20097 Live Oak Rd
- 20030 Verner Ct
- 19955 Live Oak Rd
- 19938 Ames Ct
- 20010 Verner Ct
- 19945 Ames Ct
- 20105 Live Oak Rd
- 20015 Verner Ct
- 20010 Live Oak Rd
- 20115 Live Oak Rd
- 19980 Live Oak Rd