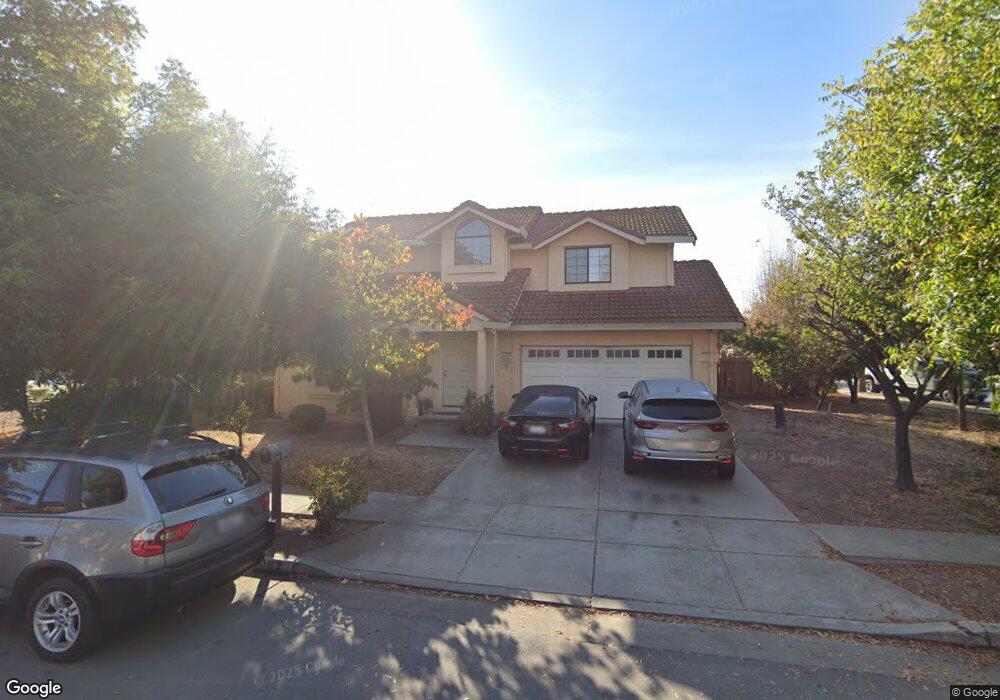
2002 Cunningham Ct San Jose, CA 95148
Ocala-Sundown NeighborhoodEstimated Value: $1,085,000 - $1,325,000
3
Beds
3
Baths
1,612
Sq Ft
$736/Sq Ft
Est. Value
About This Home
This home is located at 2002 Cunningham Ct, San Jose, CA 95148 and is currently estimated at $1,186,097, approximately $735 per square foot. 2002 Cunningham Ct is a home located in Santa Clara County with nearby schools including Thomas P. Ryan Elementary School, Ocala Middle School, and Mt. Pleasant High School.
Ownership History
Date
Name
Owned For
Owner Type
Purchase Details
Closed on
Mar 9, 2010
Sold by
Castro Maria N
Bought by
Dang Hai Huu and Dang Nga Thanh
Current Estimated Value
Purchase Details
Closed on
Mar 28, 2008
Sold by
Ting Henry Saiping
Bought by
Ting Henry Sai Ping and Cheung Ai Yu
Create a Home Valuation Report for This Property
The Home Valuation Report is an in-depth analysis detailing your home's value as well as a comparison with similar homes in the area
Home Values in the Area
Average Home Value in this Area
Purchase History
We collect this data history from publicly available records. To have your information removed, we recommend requesting removal directly through your county’s website.
| Date | Buyer | Sale Price | Title Company |
|---|---|---|---|
| Dang Hai Huu | $265,000 | Chicago Title Company | |
| Ting Henry Sai Ping | -- | None Available |
Source: Public Records
Tax History
| Year | Tax Paid | Tax Assessment Tax Assessment Total Assessment is a certain percentage of the fair market value that is determined by local assessors to be the total taxable value of land and additions on the property. | Land | Improvement |
|---|---|---|---|---|
| 2025 | $8,870 | $515,117 | $211,565 | $303,552 |
| 2024 | $8,870 | $505,017 | $207,417 | $297,600 |
| 2023 | $8,058 | $495,115 | $203,350 | $291,765 |
| 2022 | $7,905 | $485,408 | $199,363 | $286,045 |
| 2021 | $7,629 | $475,891 | $195,454 | $280,437 |
| 2020 | $7,472 | $471,012 | $193,450 | $277,562 |
| 2019 | $7,266 | $461,777 | $189,657 | $272,120 |
| 2018 | $7,168 | $452,724 | $185,939 | $266,785 |
| 2017 | $7,190 | $443,848 | $182,294 | $261,554 |
| 2016 | $6,787 | $435,146 | $178,720 | $256,426 |
| 2015 | $6,781 | $428,611 | $176,036 | $252,575 |
| 2014 | $6,272 | $420,216 | $172,588 | $247,628 |
Source: Public Records
Map
Nearby Homes
- 2948 Moss Point Dr
- 2029 Hayworth Dr
- 3250 Sylvan Dr
- 2878 Glen Ascot Way
- 3267 Sueno Dr
- 1519 Mount Everest Ct
- 3323 Prado Ln
- 2398 Arden Way
- 2575 Gumdrop Dr
- 1278 Leeward Dr
- 1219 Farringdon Dr
- 2177 Sullivan Ave
- 1818 Mount Kenya Dr
- 2808 Quest Ct
- 3367 Holderman Dr
- 3410 Gila Dr
- 3485 Rubion Ct
- 2678 Ramsdell Place
- 1711 Cathay Dr
- 10097 Torrance Ave
- 2015 Cunningham Ct
- 2013 Cunningham Ct
- 2017 Cunningham Ct
- 2825 Cunningham Ave
- 2019 Cunningham Ct
- 2819 Cunningham Ave
- 2008 Cunningham Ct
- 2014 Cunningham Ct
- 2009 Cunningham Ct
- 2007 Cunningham Ct
- 2020 Cunningham Ct
- 2003 Cunningham Ct
- 2184 Cunningham Ct
- 2199 Cunningham Ct
- 2951 Cunningham Ave
- 2731 Cunningham Ave
- 2180 Cunningham Ct
- 2698 Pixanne Ct
- 2955 Cunningham Ave
- 2694 Pixanne Ct
Your Personal Tour Guide
Ask me questions while you tour the home.