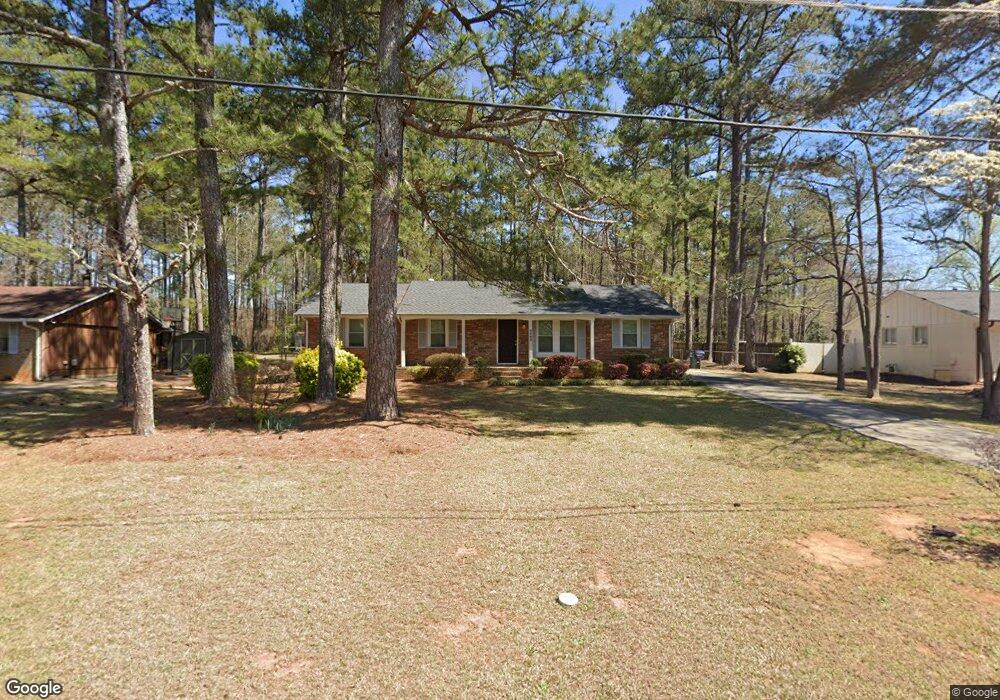
2002 Devore Dr SW Unit II Marietta, GA 30008
Southwestern Marietta NeighborhoodEstimated Value: $235,000 - $282,000
3
Beds
2
Baths
1,375
Sq Ft
$187/Sq Ft
Est. Value
About This Home
This home is located at 2002 Devore Dr SW Unit II, Marietta, GA 30008 and is currently estimated at $256,838, approximately $186 per square foot. 2002 Devore Dr SW Unit II is a home located in Cobb County with nearby schools including Hollydale Elementary School, Smitha Middle School, and Osborne High School.
Ownership History
Date
Name
Owned For
Owner Type
Purchase Details
Closed on
Jan 3, 2022
Sold by
Mercatura Group Llc
Bought by
Rs Rental Iii-A Llc
Current Estimated Value
Purchase Details
Closed on
Apr 14, 1997
Sold by
Atlanta Coalition-Consumer Education
Bought by
Bailey Sherrie T
Home Financials for this Owner
Home Financials are based on the most recent Mortgage that was taken out on this home.
Original Mortgage
$84,956
Interest Rate
7.98%
Mortgage Type
FHA
Purchase Details
Closed on
Mar 28, 1994
Sold by
Young Melanie A
Bought by
Mayes Stephan Belinda
Home Financials for this Owner
Home Financials are based on the most recent Mortgage that was taken out on this home.
Original Mortgage
$57,700
Interest Rate
7.5%
Mortgage Type
FHA
Create a Home Valuation Report for This Property
The Home Valuation Report is an in-depth analysis detailing your home's value as well as a comparison with similar homes in the area
Home Values in the Area
Average Home Value in this Area
Purchase History
| Date | Buyer | Sale Price | Title Company |
|---|---|---|---|
| Rs Rental Iii-A Llc | $204,100 | Hankin & Pack Llc | |
| Mercatura Group Llc | $185,000 | None Listed On Document | |
| Bailey Sherrie T | $85,000 | -- | |
| Mayes Stephan Belinda | $9,000 | -- |
Source: Public Records
Mortgage History
| Date | Status | Borrower | Loan Amount |
|---|---|---|---|
| Previous Owner | Bailey Sherrie T | $84,956 | |
| Previous Owner | Mayes Stephan Belinda | $57,700 |
Source: Public Records
Tax History
| Year | Tax Paid | Tax Assessment Tax Assessment Total Assessment is a certain percentage of the fair market value that is determined by local assessors to be the total taxable value of land and additions on the property. | Land | Improvement |
|---|---|---|---|---|
| 2025 | $2,460 | $81,640 | $20,000 | $61,640 |
| 2024 | $2,461 | $81,640 | $20,000 | $61,640 |
| 2023 | $2,758 | $91,484 | $20,000 | $71,484 |
Source: Public Records
Map
Nearby Homes
- 2117 Red Berry Ln SW
- 2060 Powder Springs Rd SW
- 1961 Oak Leaf Ct SW
- 3012 Sasanqua Ln SW
- 1970 Powder Springs Rd SW
- 3010 Bay Berry Dr SW
- 5915 Titan Ln SW
- 1724 Milford Church Rd SW
- 2328 Horseshoe Bend Rd SW
- 2369 Red Barn Rd SW
- 2099 Redbud Ct SW
- 2318 Powder Springs Rd SW
- 1697 Rustic Dr SW
- 2860 Powder Horn Trail SW Unit 2
- 1225 Powder Springs Rd SW
- 2400 Hampton Estates Dr SW
- 3112 Patriot Square SW
- 3100 Patriot Square SW
- 3047 Patriot Square SW
- 1680 Milford Creek Overlook SW
- 2002 Devore Dr SW
- 2012 Devore Dr SW
- 1992 Devore Dr SW Unit 18
- 1992 Devore Dr SW
- 1992 Devore Dr SW Unit II
- 2022 Devore Dr SW
- 1976 Devore Dr SW Unit II
- 2795 Valley Brook Dr SW
- 2790 Valley Brook Dr SW
- 1952 Devore Dr SW
- 2021 Devore Dr SW
- 1981 Devore Dr SW
- 2032 Devore Dr SW Unit 2
- 1942 Devore Dr SW
- 2800 Valley Brook Dr SW
- 2045 Devore Dr SW
- 1936 Devore Dr SW
- 1936 Devore Dr SW
- 2811 Valley Brook Dr SW Unit 2
- 1971 Devore Dr SW Unit 34
Your Personal Tour Guide
Ask me questions while you tour the home.