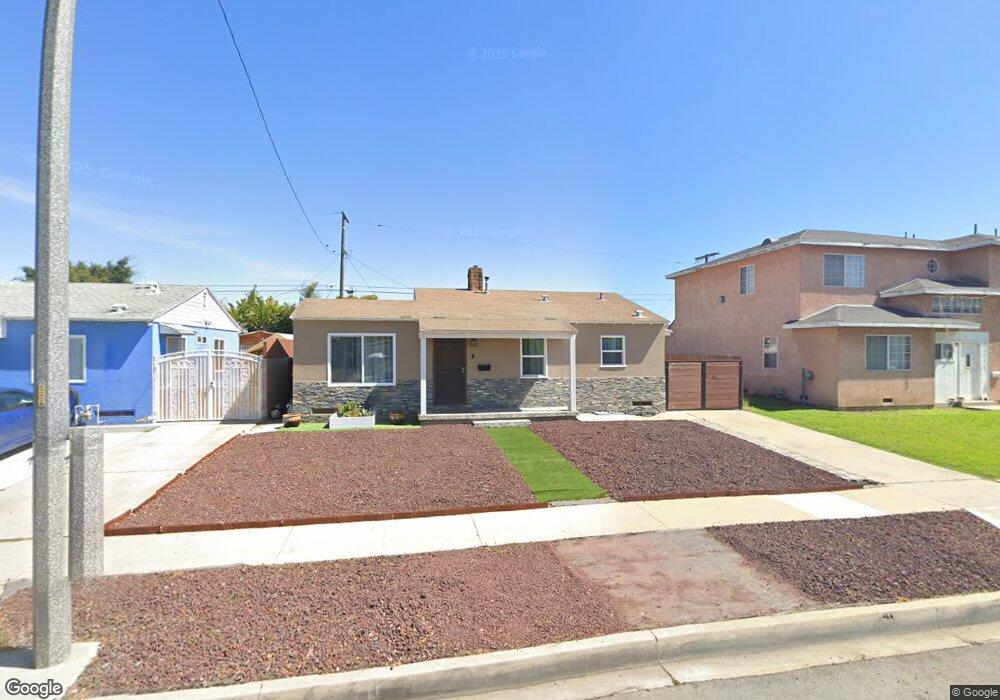
2002 N Corlett Ave Los Angeles, CA 90059
Estimated Value: $524,050 - $693,000
2
Beds
1
Bath
769
Sq Ft
$811/Sq Ft
Est. Value
About This Home
This home is located at 2002 N Corlett Ave, Los Angeles, CA 90059 and is currently estimated at $623,763, approximately $811 per square foot. 2002 N Corlett Ave is a home located in Los Angeles County with nearby schools including McKinley Elementary School, Enterprise Middle School, and Centennial High School.
Ownership History
Date
Name
Owned For
Owner Type
Purchase Details
Closed on
Sep 27, 2004
Sold by
Stansberry Marsha A and Stansberry Marsha
Bought by
Stansberry Marsha A
Current Estimated Value
Home Financials for this Owner
Home Financials are based on the most recent Mortgage that was taken out on this home.
Original Mortgage
$168,750
Outstanding Balance
$82,932
Interest Rate
5.76%
Mortgage Type
New Conventional
Estimated Equity
$540,831
Purchase Details
Closed on
Jan 11, 2000
Sold by
Trust Robinson Shirley Tr Thelma R Huber
Bought by
Stansberry Marsha
Home Financials for this Owner
Home Financials are based on the most recent Mortgage that was taken out on this home.
Original Mortgage
$81,851
Interest Rate
8.16%
Mortgage Type
FHA
Purchase Details
Closed on
May 15, 1998
Sold by
Hubert Thelma R
Bought by
Robinson Shirley A and The Thelma Hubert Family Trust
Create a Home Valuation Report for This Property
The Home Valuation Report is an in-depth analysis detailing your home's value as well as a comparison with similar homes in the area
Home Values in the Area
Average Home Value in this Area
Purchase History
| Date | Buyer | Sale Price | Title Company |
|---|---|---|---|
| Stansberry Marsha A | -- | -- | |
| Stansberry Marsha | $82,000 | First American Title Co | |
| Robinson Shirley A | -- | -- |
Source: Public Records
Mortgage History
| Date | Status | Borrower | Loan Amount |
|---|---|---|---|
| Open | Stansberry Marsha A | $168,750 | |
| Previous Owner | Stansberry Marsha | $81,851 | |
| Closed | Stansberry Marsha | $2,460 |
Source: Public Records
Tax History Compared to Growth
Tax History
| Year | Tax Paid | Tax Assessment Tax Assessment Total Assessment is a certain percentage of the fair market value that is determined by local assessors to be the total taxable value of land and additions on the property. | Land | Improvement |
|---|---|---|---|---|
| 2025 | $2,784 | $126,008 | $97,278 | $28,730 |
| 2024 | $2,784 | $123,538 | $95,371 | $28,167 |
| 2023 | $2,744 | $121,116 | $93,501 | $27,615 |
| 2022 | $2,608 | $118,742 | $91,668 | $27,074 |
| 2021 | $2,300 | $116,415 | $89,871 | $26,544 |
| 2020 | $2,556 | $115,222 | $88,950 | $26,272 |
| 2019 | $2,529 | $112,963 | $87,206 | $25,757 |
| 2018 | $2,436 | $110,749 | $85,497 | $25,252 |
| 2016 | $2,300 | $106,450 | $82,178 | $24,272 |
| 2015 | $2,212 | $104,852 | $80,944 | $23,908 |
| 2014 | $2,182 | $102,799 | $79,359 | $23,440 |
Source: Public Records
Map
Nearby Homes
- 2030 N Salinas Ave
- 2703 W 132nd St
- 13323 Mckinley Ave
- 1918 W Piru St
- 1813 W 134th St
- 825 Sweetbay Ln
- 1716 W Piru St
- 12929 S Central Ave
- 1613 W Piru St
- 1619 W 136th St
- 633 E 136th St
- 12812 Clovis Ave
- 13825 Stanford Ave
- 1505 W 136th St
- 14102 S Parmelee Ave
- 1202 E 127th St
- 14003 S Nestor Ave
- 2203 N Slater Ave
- 375 E 137th St
- 342 E 135th St
- 1910 N Corlett Ave
- 2006 N Corlett Ave
- 2001 N Keene Ave
- 2010 N Corlett Ave
- 1906 N Corlett Ave
- 2005 N Keene Ave
- 1911 N Keene Ave
- 1907 N Keene Ave
- 2009 N Keene Ave
- 2014 N Corlett Ave
- 2001 N Corlett Ave
- 1911 N Corlett Ave
- 2005 N Corlett Ave
- 1900 N Corlett Ave
- 2407 W 134th St
- 2013 N Keene Ave
- 2009 N Corlett Ave
- 1907 N Corlett Ave
- 2018 N Corlett Ave
- 1903 N Keene Ave