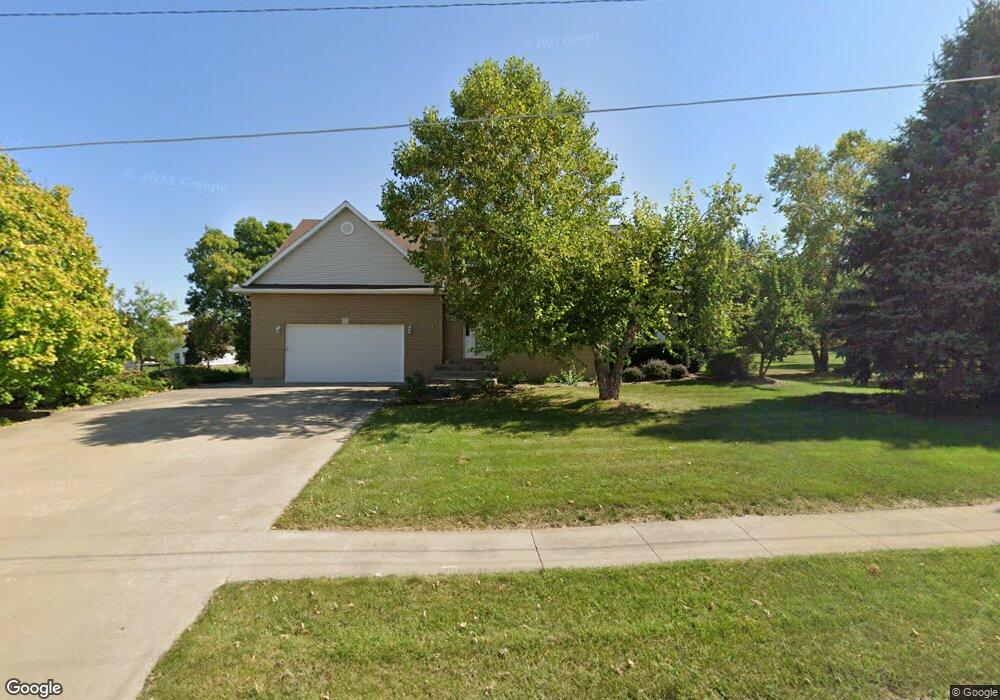
2002 S 1st Ave Vinton, IA 52349
Estimated Value: $352,000 - $531,000
3
Beds
3
Baths
3,250
Sq Ft
$129/Sq Ft
Est. Value
About This Home
This home is located at 2002 S 1st Ave, Vinton, IA 52349 and is currently estimated at $418,745, approximately $128 per square foot. 2002 S 1st Ave is a home located in Benton County with nearby schools including Tilford Elementary School, Shellsburg Elementary School, and Vinton-Shellsburg Middle School.
Ownership History
Date
Name
Owned For
Owner Type
Purchase Details
Closed on
Dec 2, 2022
Sold by
Borglum Revocable Trust
Bought by
Borglum-Austin Family Farms Llc
Current Estimated Value
Purchase Details
Closed on
Oct 31, 2006
Sold by
Westergard Rhonda L G
Bought by
Borleske Philip A and Borleske Phyllis A
Home Financials for this Owner
Home Financials are based on the most recent Mortgage that was taken out on this home.
Original Mortgage
$212,000
Interest Rate
6.45%
Mortgage Type
Future Advance Clause Open End Mortgage
Create a Home Valuation Report for This Property
The Home Valuation Report is an in-depth analysis detailing your home's value as well as a comparison with similar homes in the area
Home Values in the Area
Average Home Value in this Area
Purchase History
| Date | Buyer | Sale Price | Title Company |
|---|---|---|---|
| Borglum-Austin Family Farms Llc | -- | -- | |
| Borleske Philip A | $265,000 | None Available |
Source: Public Records
Mortgage History
| Date | Status | Borrower | Loan Amount |
|---|---|---|---|
| Previous Owner | Borleske Philip A | $212,000 |
Source: Public Records
Tax History Compared to Growth
Tax History
| Year | Tax Paid | Tax Assessment Tax Assessment Total Assessment is a certain percentage of the fair market value that is determined by local assessors to be the total taxable value of land and additions on the property. | Land | Improvement |
|---|---|---|---|---|
| 2025 | $6,542 | $403,700 | $56,800 | $346,900 |
| 2024 | $6,542 | $373,100 | $55,300 | $317,800 |
| 2023 | $6,496 | $373,100 | $55,300 | $317,800 |
| 2022 | $6,666 | $310,700 | $44,200 | $266,500 |
| 2021 | $6,666 | $310,700 | $44,200 | $266,500 |
| 2020 | $5,996 | $285,900 | $39,300 | $246,600 |
| 2019 | $6,062 | $285,900 | $39,300 | $246,600 |
| 2018 | $5,886 | $285,100 | $37,900 | $247,200 |
| 2017 | $5,656 | $285,100 | $37,900 | $247,200 |
| 2016 | $5,560 | $266,400 | $35,400 | $231,000 |
| 2015 | $5,560 | $266,400 | $35,400 | $231,000 |
| 2014 | $5,892 | $281,200 | $0 | $0 |
Source: Public Records
Map
Nearby Homes