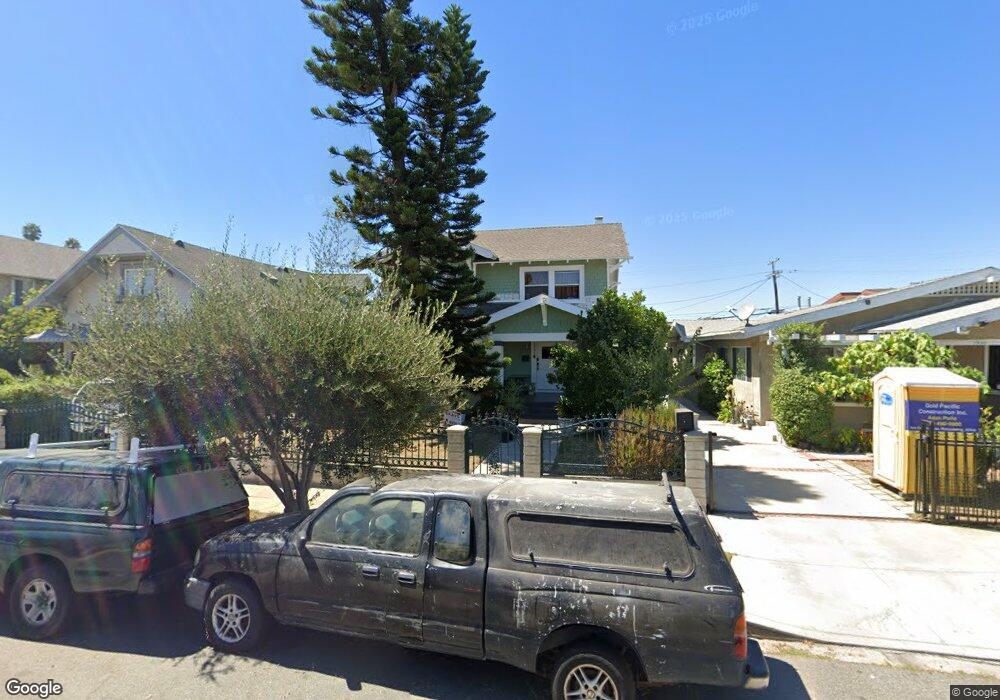
2003 7th Ave Los Angeles, CA 90018
Arlington Heights NeighborhoodEstimated Value: $758,000 - $1,149,139
4
Beds
1
Bath
2,750
Sq Ft
$327/Sq Ft
Est. Value
About This Home
This home is located at 2003 7th Ave, Los Angeles, CA 90018 and is currently estimated at $898,035, approximately $326 per square foot. 2003 7th Ave is a home located in Los Angeles County with nearby schools including Arlington Heights Elementary School, Johnnie L. Cochran Jr. Middle School, and Los Angeles Senior High School.
Ownership History
Date
Name
Owned For
Owner Type
Purchase Details
Closed on
Jun 6, 2014
Sold by
Gonzalez Guillermo
Bought by
Gonzalez Guillermo E
Current Estimated Value
Home Financials for this Owner
Home Financials are based on the most recent Mortgage that was taken out on this home.
Original Mortgage
$210,000
Outstanding Balance
$159,490
Interest Rate
4.16%
Mortgage Type
New Conventional
Estimated Equity
$738,545
Purchase Details
Closed on
Mar 13, 1998
Sold by
Federal Home Loan Mortgage Corporation
Bought by
Gonzalez Guillermo and Gonzalez Ana
Home Financials for this Owner
Home Financials are based on the most recent Mortgage that was taken out on this home.
Original Mortgage
$168,000
Interest Rate
7.07%
Mortgage Type
FHA
Purchase Details
Closed on
Dec 15, 1997
Sold by
Ponciano Thelma O and Ponciano Marco A
Bought by
Federal Home Loan Mortgage Corporation
Purchase Details
Closed on
Mar 16, 1994
Sold by
Mejia Oscar A
Bought by
Ponciano Thelma Ortiz
Create a Home Valuation Report for This Property
The Home Valuation Report is an in-depth analysis detailing your home's value as well as a comparison with similar homes in the area
Home Values in the Area
Average Home Value in this Area
Purchase History
| Date | Buyer | Sale Price | Title Company |
|---|---|---|---|
| Gonzalez Guillermo E | $280,000 | Usa National Title | |
| Gonzalez Guillermo | $150,000 | First American Title Co | |
| Federal Home Loan Mortgage Corporation | $158,000 | -- | |
| Ponciano Thelma Ortiz | -- | -- |
Source: Public Records
Mortgage History
| Date | Status | Borrower | Loan Amount |
|---|---|---|---|
| Open | Gonzalez Guillermo E | $210,000 | |
| Previous Owner | Gonzalez Guillermo | $168,000 |
Source: Public Records
Tax History
| Year | Tax Paid | Tax Assessment Tax Assessment Total Assessment is a certain percentage of the fair market value that is determined by local assessors to be the total taxable value of land and additions on the property. | Land | Improvement |
|---|---|---|---|---|
| 2025 | $6,876 | $551,626 | $490,338 | $61,288 |
| 2024 | $6,876 | $540,811 | $480,724 | $60,087 |
| 2023 | $6,751 | $530,208 | $471,299 | $58,909 |
| 2022 | $6,450 | $519,812 | $462,058 | $57,754 |
| 2021 | $6,356 | $509,621 | $452,999 | $56,622 |
| 2019 | $6,171 | $494,508 | $439,564 | $54,944 |
| 2018 | $6,030 | $484,813 | $430,946 | $53,867 |
| 2016 | $5,745 | $465,989 | $414,213 | $51,776 |
| 2015 | $5,662 | $458,991 | $407,992 | $50,999 |
| 2014 | $2,589 | $195,372 | $130,251 | $65,121 |
Source: Public Records
Map
Nearby Homes
- 2011 6th Ave
- 2016 10th Ave
- 2120 9th Ave
- 2410 8th Ave
- 3305 W 21st St
- 3305 W 21st St Unit 6
- 2415 8th Ave
- 2308 11th Ave
- 1945 S Bronson Ave
- 2111 S Bronson Ave
- 1746 Crenshaw Blvd
- 2104 Crenshaw Blvd
- 1827 Crenshaw Blvd
- 1857 Crenshaw Blvd
- 1642 Crenshaw Blvd
- 1709 Crenshaw Blvd
- 1504 S Bronson Ave
- 2625 W 17th St
- 2632 W 16th Place
- 1685 S Victoria Ave
- 1933 7th Ave
- 2011 7th Ave
- 2013 7th Ave
- 1927 7th Ave
- 2002 8th Ave Unit 4
- 2002 8th Ave Unit A
- 2002 8th Ave
- 2021 7th Ave Unit GUEST HOUS
- 2021 7th Ave
- 1923 7th Ave
- 2010 8th Ave
- 2016 8th Ave Unit 3
- 2016 8th Ave
- 2012 8th Ave
- 2025 7th Ave
- 1922 7th Ave Unit 1922
- 2000 7th Ave
- 2018 8th Ave Unit 2
- 2018 8th Ave
- 2010 7th Ave
Your Personal Tour Guide
Ask me questions while you tour the home.