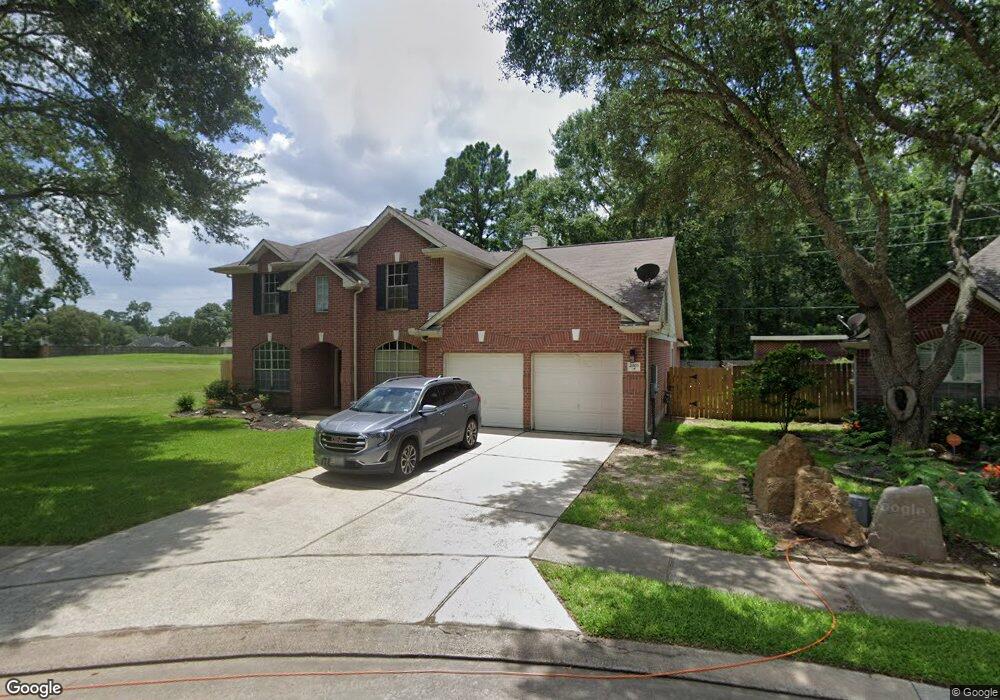
2003 Westover Park Cir Spring, TX 77386
Imperial Oaks NeighborhoodEstimated Value: $373,225 - $401,000
4
Beds
3
Baths
2,749
Sq Ft
$141/Sq Ft
Est. Value
About This Home
This home is located at 2003 Westover Park Cir, Spring, TX 77386 and is currently estimated at $386,306, approximately $140 per square foot. 2003 Westover Park Cir is a home located in Montgomery County with nearby schools including Kaufman Elementary School, Vogel Intermediate School, and Irons J High School.
Ownership History
Date
Name
Owned For
Owner Type
Purchase Details
Closed on
Jul 5, 2017
Sold by
Siddiqi Mohammad I and Siddiqi Naila
Bought by
Gleckler Veeonica and Cleckler Michael
Current Estimated Value
Home Financials for this Owner
Home Financials are based on the most recent Mortgage that was taken out on this home.
Original Mortgage
$241,544
Outstanding Balance
$198,915
Interest Rate
3.75%
Mortgage Type
FHA
Estimated Equity
$187,391
Purchase Details
Closed on
Feb 26, 2004
Sold by
Mhi Partnership Ltd
Bought by
Bennett Karen
Purchase Details
Closed on
Oct 8, 2001
Sold by
Mhi Partnership Ltd
Bought by
Siddiqi Mohammad I and Siddiqi Naila
Home Financials for this Owner
Home Financials are based on the most recent Mortgage that was taken out on this home.
Original Mortgage
$170,940
Interest Rate
6.88%
Purchase Details
Closed on
Jul 31, 1998
Sold by
Imperial Oaks Joint Venture
Bought by
Siddiqi Mohammad I and Siddiqi Naila
Create a Home Valuation Report for This Property
The Home Valuation Report is an in-depth analysis detailing your home's value as well as a comparison with similar homes in the area
Home Values in the Area
Average Home Value in this Area
Purchase History
| Date | Buyer | Sale Price | Title Company |
|---|---|---|---|
| Gleckler Veeonica | -- | Capital Title | |
| Bennett Karen | -- | Millennium Title Houston | |
| Siddiqi Mohammad I | -- | Stewart Title | |
| Siddiqi Mohammad I | -- | -- |
Source: Public Records
Mortgage History
| Date | Status | Borrower | Loan Amount |
|---|---|---|---|
| Open | Gleckler Veeonica | $241,544 | |
| Previous Owner | Siddiqi Mohammad I | $170,940 |
Source: Public Records
Tax History
| Year | Tax Paid | Tax Assessment Tax Assessment Total Assessment is a certain percentage of the fair market value that is determined by local assessors to be the total taxable value of land and additions on the property. | Land | Improvement |
|---|---|---|---|---|
| 2025 | $5,433 | $362,129 | -- | -- |
| 2024 | $5,433 | $329,208 | -- | -- |
| 2023 | $4,837 | $299,280 | $58,000 | $287,420 |
| 2022 | $6,274 | $272,070 | $13,500 | $307,760 |
| 2021 | $6,141 | $247,340 | $13,500 | $250,110 |
| 2020 | $5,811 | $224,850 | $13,500 | $211,350 |
| 2019 | $6,049 | $239,640 | $13,500 | $226,140 |
| 2018 | $5,090 | $219,230 | $13,500 | $205,730 |
| 2017 | $6,066 | $223,700 | $13,500 | $210,200 |
| 2016 | $6,066 | $223,700 | $13,500 | $210,200 |
| 2015 | $5,463 | $223,700 | $13,500 | $210,200 |
| 2014 | $5,463 | $194,810 | $13,500 | $181,310 |
Source: Public Records
Map
Nearby Homes
- 10997 Mercer Estates Ct
- 1718 Stonehaven Village Cir
- 1927 Enchanted Park Dr
- 1611 Sterling Village Dr
- 1723 Forestburg Dr
- 23925 Dorrington Estates Ln
- 31302 Perlican Dr
- 1711 Telkwa Dr
- 22941 Antiqua Estates Ct
- 1227 Caraquet Dr
- 1514 Buchans Dr
- 1915 W Welsford Dr
- 31214 Windcrest Park Ln
- 1306 Caraquet Dr
- 31315 Copperleaf Dr
- 2202 Stoneycreek Park Ct
- 1314 Coppercrest Dr
- 2511 Bridgestone Park Ln
- 1407 Buchans Dr
- 32119 Archer Park
- 2007 Westover Park Cir
- 2011 Westover Park Cir
- 2002 Westover Park Cir
- 2015 Westover Park Cir
- 2010 Westover Park Cir
- 2018 Westover Park Cir
- 31303 Roseville Park Ct
- 31307 Roseville Park Ct
- 31311 Roseville Park Ct
- 31323 Roseville Park Ct
- 2027 Westover Park Cir
- 1818 Ashton Village Dr
- 2031 Westover Park Cir
- 2007 Copperwood Park Ln
- 2011 Copperwood Park Ln
- 1814 Ashton Village Dr
- 2015 Copperwood Park Ln
- 31302 Roseville Park Ct
- 1802 Kensington Park Cir
- 31306 Roseville Park Ct
Your Personal Tour Guide
Ask me questions while you tour the home.