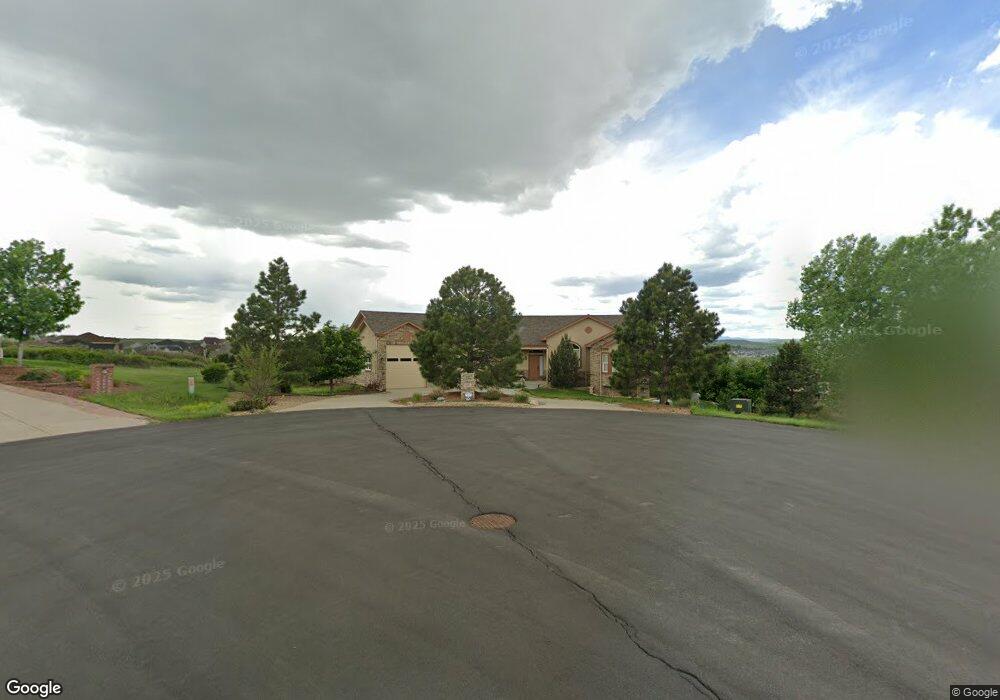
20031 E Hanging J Ranch Place Parker, CO 80134
Estimated Value: $1,057,000 - $1,328,000
5
Beds
4
Baths
4,243
Sq Ft
$274/Sq Ft
Est. Value
About This Home
This home is located at 20031 E Hanging J Ranch Place, Parker, CO 80134 and is currently estimated at $1,164,113, approximately $274 per square foot. 20031 E Hanging J Ranch Place is a home located in Douglas County with nearby schools including Mountain View Elementary School, Northeast Elementary School, and Sagewood Middle School.
Ownership History
Date
Name
Owned For
Owner Type
Purchase Details
Closed on
Dec 18, 2017
Sold by
Robinson John P and Robinson Michelle M
Bought by
Donna Whipple Kolosky Living Trust
Current Estimated Value
Purchase Details
Closed on
Jun 20, 2005
Sold by
Peek Construction Co Llc
Bought by
Robinson John F and Robinson Michelle M
Home Financials for this Owner
Home Financials are based on the most recent Mortgage that was taken out on this home.
Original Mortgage
$468,000
Interest Rate
7%
Mortgage Type
Unknown
Purchase Details
Closed on
Feb 18, 2004
Sold by
Luskey Randy K
Bought by
Peek Clyde
Home Financials for this Owner
Home Financials are based on the most recent Mortgage that was taken out on this home.
Original Mortgage
$355,600
Interest Rate
5.86%
Mortgage Type
Construction
Purchase Details
Closed on
Sep 9, 2003
Sold by
Madison Development Llc
Bought by
Luskey Randy K
Create a Home Valuation Report for This Property
The Home Valuation Report is an in-depth analysis detailing your home's value as well as a comparison with similar homes in the area
Home Values in the Area
Average Home Value in this Area
Purchase History
| Date | Buyer | Sale Price | Title Company |
|---|---|---|---|
| Donna Whipple Kolosky Living Trust | $695,850 | Land Title Guarantee Co | |
| Robinson John F | $585,000 | Security Title | |
| Peek Construction Co Llc | -- | Security Title | |
| Peek Clyde | $125,900 | Land Title | |
| Luskey Randy K | -- | -- | |
| Luskey Randy K | $514,500 | -- |
Source: Public Records
Mortgage History
| Date | Status | Borrower | Loan Amount |
|---|---|---|---|
| Previous Owner | Robinson John F | $468,000 | |
| Previous Owner | Peek Clyde | $355,600 | |
| Closed | Peek Clyde | $35,500 |
Source: Public Records
Tax History Compared to Growth
Tax History
| Year | Tax Paid | Tax Assessment Tax Assessment Total Assessment is a certain percentage of the fair market value that is determined by local assessors to be the total taxable value of land and additions on the property. | Land | Improvement |
|---|---|---|---|---|
| 2024 | $6,932 | $83,040 | $24,340 | $58,700 |
| 2023 | $7,015 | $83,040 | $24,340 | $58,700 |
| 2022 | $5,008 | $57,930 | $16,900 | $41,030 |
| 2021 | $5,214 | $57,930 | $16,900 | $41,030 |
| 2020 | $4,525 | $51,120 | $13,450 | $37,670 |
| 2019 | $4,554 | $59,740 | $13,450 | $46,290 |
| 2018 | $4,240 | $46,390 | $12,370 | $34,020 |
| 2017 | $3,323 | $46,390 | $12,370 | $34,020 |
| 2016 | $3,486 | $48,310 | $10,750 | $37,560 |
| 2015 | $4,250 | $48,310 | $10,750 | $37,560 |
| 2014 | $4,399 | $44,580 | $12,120 | $32,460 |
Source: Public Records
Map
Nearby Homes
- 12953 Bridge View Ln
- 13041 Reata Ridge Dr
- 12665 S Robinson Ranch Ct
- 12824 Ironstone Way Unit 303
- 12770 Ironstone Way Unit 301
- 12926 Ironstone Way Unit 304
- 19663 E Mann Creek Dr Unit D
- 12858 Ironstone Way Unit 301
- 12858 Ironstone Way Unit 104
- 19551 E Mann Creek Dr Unit B
- 12931 Ironstone Way Unit 303
- 12912 Ironstone Way Unit 302
- 12816 Ironstone Way Unit 203
- 8387 N Sunburst Trail
- 12886 Ironstone Way Unit 303
- 13022 Coffee Tree St
- 7289 Stroh Rd
- 13050 Coffee Tree St
- 19414 E Mann Creek Dr Unit C
- 19615 E Clear Creek Trail
- 20037 E Hanging J Ranch Place
- 20054 E Hanging J Ranch Place
- 12831 S Robinson Ranch Ct
- 20098 E Hanging J Ranch Place
- 12925 Bridge View Ln
- 8126 N Highway 83
- 12933 Bridge View Ln
- 12928 Bridge View Ln
- 8122 S Parker Rd
- 20150 E Hanging J Ranch Place
- 12943 Bridge View Ln
- 20079 E Hanging J Ranch Place
- 12938 Bridge View Ln
- 12797 S Robinson Ranch Ct
- 20195 Terrace View Dr
- 12948 Bridge View Ln
- 20209 Terrace View Dr
- 12961 Bridge View Ln
- 12958 Bridge View Ln
- 20180 Terrace View Dr