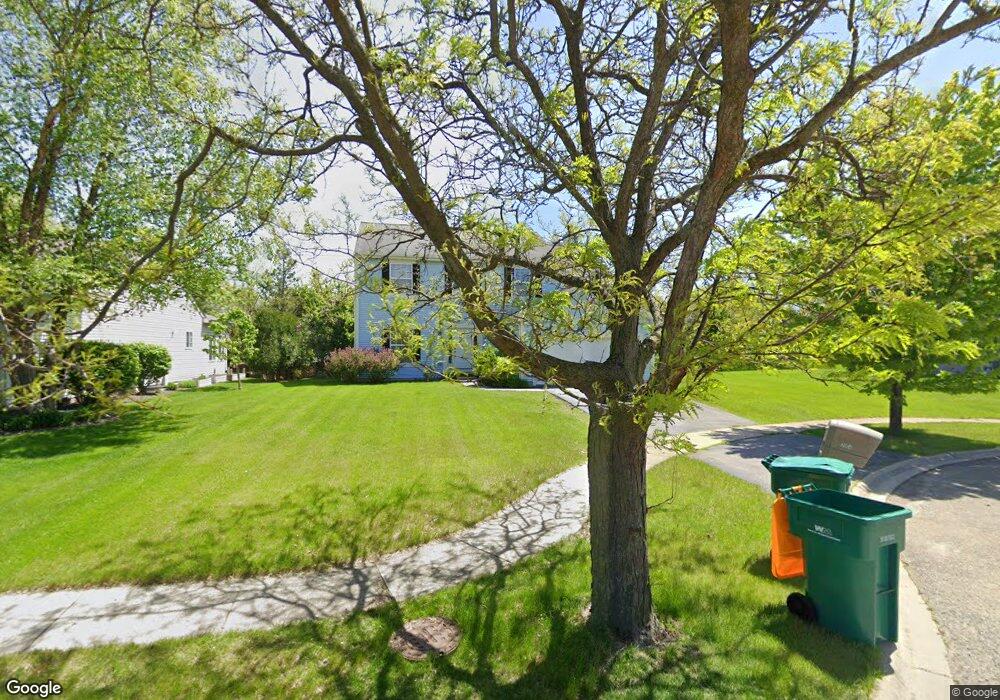
2004 Glenridge Ct Plainfield, IL 60586
Fall Creek NeighborhoodEstimated Value: $407,000 - $463,000
4
Beds
4
Baths
3,000
Sq Ft
$143/Sq Ft
Est. Value
About This Home
This home is located at 2004 Glenridge Ct, Plainfield, IL 60586 and is currently estimated at $429,053, approximately $143 per square foot. 2004 Glenridge Ct is a home located in Will County with nearby schools including Ridge Elementary School, Drauden Point Middle School, and Plainfield South High School.
Ownership History
Date
Name
Owned For
Owner Type
Purchase Details
Closed on
Jan 16, 2007
Sold by
Cartus Financial Corp
Bought by
Nelson Kirk Joseph and The Kirk Joseph Nelson Trust
Current Estimated Value
Home Financials for this Owner
Home Financials are based on the most recent Mortgage that was taken out on this home.
Original Mortgage
$237,500
Outstanding Balance
$142,008
Interest Rate
6.22%
Mortgage Type
Purchase Money Mortgage
Estimated Equity
$287,045
Purchase Details
Closed on
Jul 15, 2006
Sold by
Jennings Burnetter
Bought by
Cartus Financial Corp
Purchase Details
Closed on
Mar 28, 2002
Sold by
William Ryan Homes Inc
Bought by
Jennings Burnetter
Home Financials for this Owner
Home Financials are based on the most recent Mortgage that was taken out on this home.
Original Mortgage
$212,702
Interest Rate
10.25%
Create a Home Valuation Report for This Property
The Home Valuation Report is an in-depth analysis detailing your home's value as well as a comparison with similar homes in the area
Home Values in the Area
Average Home Value in this Area
Purchase History
| Date | Buyer | Sale Price | Title Company |
|---|---|---|---|
| Nelson Kirk Joseph | $237,500 | None Available | |
| Cartus Financial Corp | $237,500 | None Available | |
| Jennings Burnetter | $236,500 | Ticor Title |
Source: Public Records
Mortgage History
| Date | Status | Borrower | Loan Amount |
|---|---|---|---|
| Open | Nelson Kirk Joseph | $237,500 | |
| Previous Owner | Jennings Burnetter | $212,702 |
Source: Public Records
Tax History
| Year | Tax Paid | Tax Assessment Tax Assessment Total Assessment is a certain percentage of the fair market value that is determined by local assessors to be the total taxable value of land and additions on the property. | Land | Improvement |
|---|---|---|---|---|
| 2024 | $8,217 | $122,735 | $24,056 | $98,679 |
| 2023 | $8,217 | $110,852 | $21,727 | $89,125 |
| 2022 | $7,719 | $104,301 | $20,443 | $83,858 |
| 2021 | $7,321 | $97,478 | $19,106 | $78,372 |
| 2020 | $7,212 | $94,712 | $18,564 | $76,148 |
| 2019 | $6,962 | $90,244 | $17,688 | $72,556 |
| 2018 | $6,666 | $84,789 | $16,619 | $68,170 |
| 2017 | $6,469 | $80,575 | $15,793 | $64,782 |
| 2016 | $6,339 | $76,847 | $15,062 | $61,785 |
| 2015 | $5,918 | $71,988 | $14,110 | $57,878 |
| 2014 | $5,918 | $69,446 | $13,612 | $55,834 |
| 2013 | $5,918 | $69,446 | $13,612 | $55,834 |
Source: Public Records
Map
Nearby Homes
- 2008 Gray Hawk Ct
- 2115 Stafford Ct Unit 3
- 1919 Spring Ridge Dr
- 5924 Glass Pointe Cir
- 2302 Red Hawk Dr
- 2110 Wynham Lakes Ct
- 0 Theodore St
- 25011 W Ann Ct
- 1808 Castle Ridge Dr
- 5312 Floralwood Ct
- 1306 Riverhaven Trail
- 2004 Kingsbury Estates Dr
- 1605 Cascade Ridge Dr Unit 3
- 6510 Jack Rogers Ln
- 0001 S State Route 59
- 0002 S State Route 59
- 1418 Fitzer Dr
- 2509 Ruth Fitzgerald Dr
- 1504 Lasser Dr
- 2542 Stonybrook Dr
- 2006 Glenridge Ct
- 2002 Glenridge Ct Unit 1
- 2008 Glenridge Ct
- 2001 Glenridge Ct
- 2005 Glenridge Ct
- 2010 Glenridge Ct
- 2003 Gray Hawk Dr
- 2007 Glenridge Ct Unit 1
- 2005 Gray Hawk Dr
- 2001 Gray Hawk Dr
- 2003 Glenridge Ct Unit 1
- 2009 Glenridge Ct
- 2007 Gray Hawk Dr
- 2012 Glenridge Ct
- 2011 Glenridge Ct
- 2009 Gray Hawk Dr
- 5914 Alpine Way
- 5917 Arbor Gate Dr Unit 3
- 2004 Stafford St
- 2006 Stafford St Unit 1
Your Personal Tour Guide
Ask me questions while you tour the home.